
RUSSIAN JOURNAL OF EARTH SCIENCES, VOL. 21, ES4003, doi:10.2205/2021ES000767, 2021
P. A. Morozov1, A. I. Berkut2, P. L. Vorovsky2, F. P. Morozov2, S. V. Pisarev3
1Pushkov Institute of Terrestrial Magnetism, Ionosphere and Radio Wave Propagation RAS, Moscow, Russia
2LLC "Company VNIISMI", Moscow, Russia
3Shirshov Institute of Oceanology RAS, Moscow, Russia
This article documents the use of portable georadar for measuring the thickness of sea ice. This device was developed to replace the method for measuring ice thickness by drilling ice holes. The device based on the use of the LOZA georadar (ground penetrating radar, GPR) and a specially developed method of field measurements when landing on the studied ice formations. The study of the thickness and structure of sea ice by radar method is a complex problem. The salinity of sea ice determines its significant conductivity, which, in turn, causes a large attenuation of the electromagnetic signal of the georadar. The widespread GPR with a pulse power of 50–100 W are not applicable for sounding sea ice precisely because of the large signal attenuation. The LOZA instrument is equipped with a transmitter with a pulse power of 1 MW. This is, on average, 10,000 times greater than that of "traditional" GPRs. Multiple measurements of the thickness of ice formations, carried out on the one-year ice of the eastern shelf of Sakhalin Island during winter expeditions of 2016 and 2019, have shown that the device can quickly, accurately and with a high spatial resolution measure the thickness of both flat and highly deformed ice (hummocks, rafted ice, and rubble field) over large areas.
Ice thickness is measured for the benefit of both basic and applied research [GOST R, 2018; Marchenko and Morozov, 2016; Mironov et al., 2015; Pisarev, 2016]. Ice thickness information is collected for various activities such as: monitoring of ice growth and melting depending on the characteristics of the ice-ocean-atmosphere interaction; measurements of under-ice relief for acoustic research; determination of safe landing sites for aircraft or helicopters on the ice when performing rescue operations or for the installation of any measuring equipment; assessment of the suitability of the ice field for the location of an inhabited camp on it; carrying out cargo operations from ships on fast ice; development of ice thickness statistics for predicting ice pressure on offshore structures.
For several decades, the measurements of the thickness of ice cover in situ from the ice surface was determined only by drilling, and by the 1970s, an intensive search began for the measurement methods that would make it possible to determine the ice thickness faster and with greater spatial resolution compared to drilling at discrete points [Finkelstein et al., 1984]. When investigating the possibility of using radar for measuring ice thickness, a fundamental difference between fresh and sea ice from the point of view of the use of radar was found.
Sea ice is composed of fresh ice crystals and brine cells that are elongated in the vertical direction. Most of the physical properties of sea ice are related to the brine content, which changes with the age of the ice. The salinity and volume of brines depend on the salinity of the water and the rate of ice formation or melting, which, in turn, are determined by air temperature, ice thickness, and snow depth. In the most general case, the salinity of the ice is 4–5 times lower than the salinity of the water that formed it. The salinity of the sea ice determines the noticeable conductivity, which, in turn, causes a large attenuation of the electromagnetic signal of the georadar (ground penetrating radar, GPR) at frequencies of several hundred MHz. GPRs with a pulse power of 50–100 watts, which are successfully used for sounding ice in freshwater areas, are not applicable for sounding sea ice due to the large signal attenuation.
Thus, the study of the thickness and structure of sea ice by radar is a complex problem. An indirect confirmation of this is the fact that there is still only one serially produced sea ice thickness meter EM31 Ice worldwide, suitable for on-line measurements of the thickness of sea ice when the operator moves along the surface of the ice field [Eicken et al., 2001; Haas et al., 1997; Kovacs and Morey, 1991]. The meter is produced by the Canadian company Geonics and looks like a large deployed "transformer" with a visible resemblance to a GPR. During the last 30 years this meter has been used by all leading research groups in all countries.
Next, we present our completely new approach to measuring the thickness of sea ice using the LOZA GPR. The capabilities and advantages of our method were demonstrated in the study of 45 ice formations of drifting and fast sea ice on the eastern shelf of Sakhalin Island during the winter expeditions of 2016 and 2019.
During the development of the GPR LOZA, theoretical and engineering solutions were used, which were described in [Finkelstein et al., 1984] and other works on subsurface radar, prepared by a group of authors under the leadership of M. I. Finkelstein. The hardware implementation of the subsurface radar method, created by the group of Professor M. I. Finkelstein, was unique and had no analogues in the world. The developed subsurface radar equipment had record parameters corresponding to its time related to the level of development and capabilities of electronic components half a century ago. The LOZA GPR development group has repeatedly consulted with Professor M. I. Finkelstein at the Riga Institute of Civil Aviation Engineers in the second half of the 1980s.
The modern modification of the LOZA GPR incorporates the recommendations of Professor Finkelstein [Finkelstein et al., 1984] and the engineering implementation of the principles of subsurface radar at the level of electronics development at the beginning of the 21st century:
As a result, the LOZA GPR, which we used to measure the thickness of sea ice, was a mid-frequency GPR with a receiver frequency band of 50–300 MHz. The GPR transmitter commutes a 5–10 kV impulse to the antenna. The antenna emits this short pulse into the medium. The receiver, synchronously with the moment of radiation, begins to record the incoming reflections. GPR LOZA records 512 measurements in 1 nanosecond. At each moment of time, the time of arrival of the signal, its amplitude, and phase are recorded. All the time while the receiver is working on reception, the transmitter is "silent". When operating a GPR, 100 MHz (1.5 meters long) and 200 MHz (1 meter long) antennas are used. The transmitter and the GPR control unit are powered from sealed lead-acid batteries, which have a minimum loss of capacity at low negative temperatures.
The LOZA is equipped with a transmitter that has a pulse power of 1 MW. This, on average, is 10,000 times greater than that of "traditional" GPRs. It is the uniquely large energy potential of the GPR LOZA that made it possible to successfully solve the problem of sounding sea ice, despite the strong attenuation of the signal when passing through the salt ice.
Even before making practical measurements on sea ice using the LOZA GPR, based on the general laws of radar measurements, certain requirements for the performance of measurements and objective limitations for the interpretation of their results were determined:
GPR LOZA was used to determine the thickness of ice formations on the eastern shelf of Sakhalin Island during the winter expeditions of 2016 and 2019. All ice formations consisted of first-year ice. The largest in volume ice formations were selected for research: large horizontal ice fields of calm thermal growth, ice fields of rafted ice, ridges of hummocks, and ice piles on the coast. A total of 45 ice formations were surveyed.
|
| Figure 1 |
For sea ice researchers, it is clear that large ice fields and ridges of high hummocks are significant in volume and weight and pose a danger in the event of a collision with a ship or an object of marine infrastructure. Surprise of the research was the fact that among the ice formations of large volume, about half consisted of rafted ice. The rafting process is common for young ice, although it is extremely rare for first-year ice. Using the example of one of the ice formations of rafted ice numbered 7 (Figure 1), we will further show how the LOZA GPR was used to measure the ice thickness.
 |
| Figure 2 |
 |
| Figure 3 |
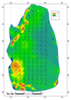
Each ice formation was covered with a grid of points with the help of topographic devices. For each point, coordinates were determined in the local coordinate system associated with the ice field. The water level in the hole drilled through the ice formation was taken as zero height. The distance between the grid nodes, as a rule, was 5 m (Figure 2 and Figure 3). The location of the extreme points of the grid was determined by the practical ability of the researcher to safely approach the edge of the ice formation. Figure 3 shows that the distance between the position of the icebreaker and the grid points closest to it is about 15 m. This is due to the fact that the icebreaker is moored to the ice formation with the help of several ropes attached to the so-called "ice anchors". Due to the difference between the drift of the icebreaker and the ice field, "ice anchors" sometimes broke out of the ice and the mooring ropes could hurt people and equipment in the vicinity of the ropes. In addition, as it was indicated in section 2 of this article, the LOZA GPR objectively cannot measure the thickness of ice near such a large metal object as an icebreaker. Thus, we did not measure the entire ice formation, but only a significant part of it.
At each point of the grid, auger drilling was performed through the ice to determine its ice thickness and the hardness of its layers. Simultaneously, two operators with the LOZA passed along the profile of the grid nodes and between the profiles of the points in the direction from the icebreaker (Figure 2 and Figure 3).
 |
| Figure 4 |
As a result, after processing the GPR signal together with the results of topographic survey, for each ice formation, a grid of ice thicknesses was constructed with a step of 0.2 m in the direction from the icebreaker and with a step of 2.5 m parallel to the icebreaker. The thickness of the ice determined by the LOZA is in good agreement with the thickness determined by auger mechanical drilling (Figure 4). Complete coincidence is impossible, since, as mentioned earlier, drilling determines the ice thickness at a point 5 cm in diameter, while the GPR determines the integral ice thickness over the area. This area depends on the thickness of the ice and for different parts of ice formation numbered 7 ranges from 0.7 m to 2.0 m.
 |
| Figure 5 |
Both photographs (Figure 1 and Figure 2) and the relief map (Figure 3) show that the surface of the ice formation numbered 7 is flat. The maximum height of hummocks is 0.78 m (Figure 3). Such hummocks cannot have a keel of 7.5 m. However, it is precisely such ice thicknesses that can be seen in Figure 1 and such measured thicknesses are shown in Figure 4. Such a large thickness of ice that is flat on the surface is achieved due to the fact that this ice is rafted. Measurements by the LOZA GPR enables one to see these layers and estimate their thickness (Figure 4). The existence of ice layers is confirmed by the results of auger mechanical drilling with an assessment of the ice hardness, as well as photographs of the underwater relief of the ice formation 7 (Figure 5).
During two winter expeditions in 2016 and 2019, using the LOZA GPR, about 700 ice thickness profiles were obtained at 45 ice formations of flat and deformed sea ice. The maximum ice thickness, both according to the results of auger mechanical drilling, and according to the measurements of the GPR, reached 14 m.
At two to five points of each ice formation, a vertical salinity profile of ice was determined with a vertical step of 0.1 m. Maximum ice salinity values at different depths of ice thickness and for different ice formations varied within 4.5–11.5 psu. Therefore, our measurements with the LOZA GPR were carried out in real salt sea ice.
There are three known devices for which there is a positive experience of their application for measuring the thickness of ice. Let us first consider the Canadian EM-31, previously described in section 1 of this article. The EM31, based on the electromagnetic induction method, is a large deployed "transformer". The first winding of the "transformer" is the primary coil of the EM31, which is fed with a continuous, amplitude-stable signal at 9.8 kHz. The second winding of the transformer is the EM31 secondary coil. The signal that is induced on the secondary winding of the "transformer" is recorded by the device. The magnitude (voltage) of this signal depends only on the quality of the "transformer" core, since the signal on the primary winding is always stable. The role of the core is played by the space surrounding the device and its primary and secondary coils, spaced 3.66 m apart. The characteristics of the upper half-space (air) are constant and do not change. The lower half-space is ice with sea water underneath. By definition, the device works only on ice formations of undisturbed structure, in which the volumetric characteristics (conductivity and salinity) are stable and do not change during the measured profile. Under such conditions, changes in the efficiency of the "transformer core" would only be associated with the changes in ice thickness. At each point, one value of the voltage of the induced signal is measured on the secondary winding of the "transformer". This value is converted into the apparent bulk conductivity of the lower hemisphere, which is indirectly related to the thickness of the ice formation.
One of the authors of this article worked with EM-31 in international expeditions. The previously mentioned dependence of the measurement results on the volumetric characteristics of ice in practice is overcome by drilling ice when a pronounced change in its properties exist on the surface. Then, the measured EM-31 signal is "fitted" by software to the ice thickness measurements, obtained by drilling within the area of profile with particular properties.
It is difficult to say which device, EM-31 or LOZA, measures the thickness of sea ice more accurately, since we did not use both of them on the same ice formations. However, it should be noted that the measurements of the LOZA, in contrast to the EM-31, do not need to be "adjusted" to the drilling results. We only used drilling ice thickness measurements to monitor the performance of our new thickness gauge. In addition, unlike EM-31, the LOZA GPR allows us to estimate not only the total thickness of ice, but also its internal structure – the presence of ice blocks, rafted ice, and water layers.
The second device that we consider here is the PIKOR-ICE manufactured in Russia. This thickness gauge is widely and very successfully used in Russia for the construction and maintenance of winter roads through rivers and other fresh water areas [Uvarov, 2013]. One of the authors of this article tried to use PIKOR-ICE to measure the thickness of sea ice in the fall of 2012. On the ice field of the Russian drifting station North Pole – 39, a 50 m long profile was marked. The profile passed through an area with one-year ice of calm thermal build-up, through an area of deformed ice, and also through an area of young ice. A total of 20 measurements were made along the profile. The height of the device above the ice, the speed of the device, and the positions of the control marks were the same for all passes. The device not only did not show the ice thickness values close to those measured using auger drilling, but all 20 ice thickness profiles were not similar to each other. Soon after this experiment, the manufacturer of PIKOR-ICE began to mention in the information about his device that it was intended only for measuring fresh (not sea) ice.
The third type of thickness gauge is two Russian GPRs of the LD series, a high-frequency LD-1200 and a low-frequency LD-400. Both devices are based on the OKO GPR [LLC "Logical Systems", 2013]. The first device, with a frequency of 1200 MHz, is presented by the manufacturer as a gauge of the thickness of fresh ice, and therefore we will not consider it further. It is stated that LD-400 is a GPR that is capable of measuring the thickness of sea ice up to 5 m thick (https://geodevice.ru/main/gpr/kit/ab_ice/?sphra se_id=42476). The OKO GPR with a central frequency of 400 MHz is equipped with a transmitter having a pulse amplitude of 250 V [LLC "Logical Systems", 2013]. The pulse amplitude in volts for the LOZA GPR, is equal to 10,000 V. The powers of the georadars are related as the squares of their pulse amplitudes. Thus, the power of the LOZA GPR is 1600 times greater comparing with the LD-400 one. Considering such a big difference in power, the ability of the LD-400 to measure salty sea ice is questionable. Nevertheless, as a result of personal communications, the authors of this article are informed about one fact of using the LD-400 on the sea ice.
In March 2017, an expedition of the Ministry of Defense of the Russian Federation made a transfer of several types of wheeled and tracked vehicles of Arctic design from the village of Tiksi to the Novosibirsk Islands and back. About 2000 km were covered on the fast ice of the Laptev Sea. The expedition members used the LD-400, mounted on a car in order to quickly measure the thickness of the ice while driving. At intermittent stops, the expedition members measured the ice thickness using mechanical drilling, and in dozens of drilling cases, good agreement was obtained between the two methods for measuring ice thickness. The thickness of the ice was 1.0–1.7 m.
The expedition members did not measure the salinity of the fast ice. However, it should be noted that the usual salinity of the upper layer of the Laptev Sea along the expedition route in September, before the beginning of the ice formation process, is in the range of 9–18 psu [Sokolov et al., 2007]. If we assume that the fast ice, which is formed from this water, has a salinity of 4–5 times less, then its salinity does not exceed 4 psu. It is possible that the very fact that the ice in the Laptev Sea was so fresh can explain the fact that the LD-400 GPR, weak in power, successfully measured the ice with the maximum thickness equal to 1.7 m.
A new device for measuring the thickness and internal structure of salted sea ice without drilling has been developed. A method of practical application of the device has also been developed. The device is a modification of the Russian LOZA GPR. A distinctive feature of the LOZA is its pulse power, which exceeds 10,000 times the power of other radars. Using the LOZA GPR areal measurements at 45 ice formations on the eastern shelf of Sakhalin Island were carried out, as a part of the 2016 and 2019 winter expeditions. GPR LOZA is capable of measuring salt ice thickness of 14 m and greater, measuring flat ice of calm thermal build-up, identifying blocks and layers of ice, as well as layers of water and air inside a deformed ice formation.
Berkut, A. I., D. E. Edemsky, V. V. Kopeikin, et al. (2017) , Deep penetration subsurface radar: hardware, results, interpretation, Proc. 9th Int. Symp. on Advanced Ground Penetrat. Radar (IWAGPR), PS-2, p. 3–25, IEEE, Edinbourgh, UK, https://doi.org/10.1109/IWAGPR.2017.7996052.
Eicken, H., W. B. Tucker III, D. K. Perovich (2001) , Indirect measurements of the mass balance of summer Arctic sea ice with an electromagnetic induction technique, Annals of Glaciology, 33, p. 194–200, https://doi.org/10.3189/172756401781818356.
Finkelstein, M. I., E. I. Lazarev, A. N. Chizhov (1984) , Radar Aerial Ice Surveys of Rivers, Lakes, Reservoirs, 112 pp., Gidrometeoizdat, Leningrad (in Russian).
Haas, C., S. Gerland, H. Eicken, H. Miller (1997) , Comparisono of sea-ice thickness measurements under summer and winter conditions in the Arctic using a small electromagnetic induction device, Geophysics, 62, p. 749–757, https://doi.org/10.1190/1.1444184.
GOST R 58283-2018, (2018) , National Standard of the Russian Federation. Oil and Gas Industry Arctic Operations. Consideration of Ice Loads in the Design of Offshore Platforms, 36 pp., Standartinform, Moscow (in Russian).
Kovacs, A., R. M. Morey (1991) , Sounding sea-ice thickness using a portable electromagnetic induction instrument, Geophysics, 56, p. 1992–1998, https://doi.org/10.1190/1.1443011.
LLC "Logical Systems", (2013) , Radio-Technical Device for Subsurface Sounding (Georadar) "OKO-2", Technical Description and User's Manual, 98 pp., Ramenskoye, Moscow region (in Russian).
Marchenko, A. V., E. G. Morozov (2016) , Surface manifestations of the waves in the ocean covered with ice, Russ. J. Earth Sci., 16, p. ES1001, https://doi.org/10.2205/2016ES000561.
Mironov, E. U., Yu. P. Gudoshnikov, V. N. Smirnov (2015) , Modern methods of ice research and surveys on the shelf of the Arctic seas, Problems of the Arctic and Antarctic, no. 1 (103), p. 57–68 (in Russian).
Pisarev, S. V. (2016) , Winter expeditionary research in the water area of the Yuzhno-Kirinskoye field in 2016, Russian Polar Research, 3, no. 25, p. 8–11 (in Russian).
Sokolov, V. T., S. V. Kochetov, N. V. Lebedev, et al. (2007) , Climatic Fields of Thermohaline Characteristics of the Laptev Sea, Electronic Reference Manual, AARI, St. Petersburg (in Russian).
Uvarov, U. (2013) , Pikor-Ice: Russian UWB technology, First Mile, 6, p. 60–62 (in Russian).
Received 12 April 2021; accepted 24 April 2021; published 14 August 2021.

Citation: Morozov P. A., A. I. Berkut, P. L. Vorovsky, F. P. Morozov, S. V. Pisarev (2021), Measuring sea ice thickness with the LOZA georadar, Russ. J. Earth Sci., 21, ES4003, doi:10.2205/2021ES000767.
Copyright 2021 by the Geophysical Center RAS.