
RUSSIAN JOURNAL OF EARTH SCIENCES, VOL. 20, ES14015, doi:10.2205/2020ES000729, 2020
V. Grigorieva, S. K. Gulev
Shirshov Institute of Oceanology RAS, Moscow, Russia
Wave climate in the North Atlantic and subarctic seas is investigated based on data from Voluntary Observing Ships for the period 1900–2020. The proposed approach differs from any previous studies of the given region as a detailed climatology and long-term trends were performed separately for wind sea and swell characteristics. The method allows for tracing Arctic climate tendencies of the last century and analyzing the reasons behind the observed changes taking place.
The global climate has been undergoing significant yet poorly understood anomalies in the recent decades, with the most extreme changes being manifested in the Arctic region. Climate tendencies in the subpolar North Atlantic and adjacent Arctic are not limited to the ice concentration (thickness and extent) and ocean and atmospheric temperatures – the main predictors of climate change – but also include wind wave characteristics [Marchenko and Morozov, 2016]. The region in question forms a strong air-sea interaction and wind signals, associated with significant mesoscale variability [Gavrikov et al., 2020]. Earlier Gulev and Grigorieva [2006] demonstrated strong variability of wind waves in the southern part of this region and associated it with changes in the cyclone activity. In this respect regional analysis of wave characteristics on interdecadal to centennial time scales is quite limited mostly due to the lack of long-term observational records.
The worldwide observational network for ocean wind waves is constantly evolving and currently includes buoys and satellite altimetry, as well as a wide range of observational platforms equipped with the most modern devices. The derived measurements are supplemented by global and regional wave and climate models which yield high-quality wave simulations: hindcasts and reanalysis. However, the wave data sources listed above cover only relatively short period of up to 50 years with most products dating back to the late 1970s. These data typically do not allow for tracking climate trends on multidecadal time scales. In this regard, visual wave observations (Voluntary Observing Ships, hereinafter VOS) provide the longest duration of data records effectively from 1888 to the present. Moreover, VOS data offer separate estimates of wind sea and swell characteristics [Freeman et al., 2017; Gulev et al., 2003; Grigorieva et al., 2017]. This comes as an advantage over remote sensing measurements and even model solutions where sea and swell separation is quite uncertain and largely relies on the model setting and on the methods of wave components identification [Markina et al., 2019; Portilla et al., 2009]. Therefore, in this study the analysis is focused on the wind sea and swell components, their climatological characteristics and long-term trends.
Commonly accepted concerns about low accuracy of the visual wave observations and relatively difficult procedures of data preprocessing unduly limit the applications of this unique dataset. However, various methods of the estimation of biases in VOS data and their correction have been recently developed along with multistage quality control procedures [Badulin and Grigorieva, 2012; Gulev et al., 2003]. Moreover, the accuracy of the VOS data is proven to be comparable or even superior to modern measurements [Grigorieva et al., 2020; Lavrova et al., 2011; Vignudelli et al., 2011].
Visual wave observations are primarily used for global wave climate analysis [Grigorieva and Badulin, 2016; Grigorieva et al., 2020; Gulev et al., 2003; Kent et al., 2019] as they cover the entire World Ocean, although they are characterized by strong sampling inhomogeneity in space and uneven sampling density in time. Model simulations and satellite measurements are sometimes considered superior in that regard and are more frequently used for wave studies in the last few decades [Badulin et al., 2018]. Nevertheless, the observational density of visual wave observations is comparable to the other meteorological variables [Gulev et al., 2007].
Wave climate studies for individual seas or selected regions are usually based on stationary buoy and platforms measurements, regional wave model simulations and short-term field experiments [Khimchenko et al., 2020; Lopatukhin et al., 2002, 2003; Markina and Gavrikov, 2016; Reistad et al., 2011; Saprykina and Kuznetsov, 2018a, 2018b]. This paper represents a novel analysis of the long-term wave climate tendencies for the subpolar North Atlantic Ocean including the Greenland, Norwegian, and Barents seas, based on the VOS data for the period of 120 years (1900–2020). The subpolar North Atlantic and Arctic region considered is bound between 60° N–80° N and 20° W–40° E. The selected study region is characterized by intense wind wave variability, especially in the conditions of severe weather. In winter season, wave heights can exceed 20 m in the Norwegian and Greenland seas, while the duration of "weather windows" (periods with waves less than 1.5 m) is never more than 3 days. In the Barents Sea, winter wave heights can exceed 19 meters in the western and central parts, and the probability of waves higher than 8 meters is about 2% [Davidan and Lopatukhin, 1982]. In the context of the Arctic warming amplification and the intense decline of sea ice extent [Stroeve et al., 2012], regional wave variability can further complement the analysis of the ongoing climate processes in this area.
Voluntary Observing Ships measurements are distinguished by the unchanging observational practice since 1853 with well-trained observers (marine officers or mates) estimating sea state characteristics along with atmospheric and oceanic parameters, and environmental characteristics. The visual approach, nevertheless, provides quite an accurate estimate ensuring the homogeneity of the resulted time series of wave characteristics in terms of observational practice. This makes VOS data useful for identifying and quantifying different wave systems and their parameters over longer periods.
The global collection of visual wave observations is consolidated in the ICOADS (International Comprehensive Ocean Atmosphere Data Set, http://ico ads.noaa.gov/) archive [Freeman et al., 2017]. This dataset consists of the individual records providing about 100 marine and atmospheric parameters of surface meteorological observations at a given point along with metadata information on the measurement techniques and data quality flags. The study uses a historical archive developed on the base of ICOADS in [Grigorieva et al., 2017], which optimized and improved the accuracy of initial wave data records. New records added to the set provide a regular update of the collection.
|
| Figure 1 |
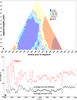
The temporal distribution of the number of reports is presented in Figure 1a with the number of reports for the wind sea height shown in black and for swell height shown in grey. Wind sea height is reported more frequently compared to any other parameter. Even in the beginning of the 20th century, the annual number of observations was about 10,000, closely approaching 1,000,000 reports in the last five decades. Swell height count is at least two times lower than that for the wind sea. There is a notable gap in data coverage for this region over the period of WWI, while during WWII the reports were provided slightly less frequently compared to the adjacent periods.
Spatial inhomogeneity of sampling is the main drawback of the visual wave observations. Figure 1b shows spatial distribution of the average number of wind sea height observations for a calendar month in $1\mbox{°} \times 1\mbox{°}$ boxes. The highest observational density is observed along major ship routes, while the smallest number of the reports is found in the northern areas of the region which are extensively covered by ice during the year. Nevertheless, observational density is higher compared to the other regions and allows for reproducing reliable $1\mbox{°} \times 1\mbox{°}$ monthly mean fields of wave characteristics.
 |
| Figure 2 |
 |
| Figure 3 |
Using all the data available in this region we have developed spatial grids of all wave parameters for each calendar month over the 120-year period. To initiate this procedure we used for the intrabox averaging only the data which passed the quality control. As the next step, climatological distributions for each month, season and year (Figure 2, Figure 3) were derived for $1\mbox{°} \times 1\mbox{°}$ grids, thus forming the regime characteristics of wind wave climate for the area. The ice mask was applied according to the winter position of the ice margin.
The distributions of annual wind sea heights (Figure 2a) and periods (Figure 2c) show quite a homogeneous pattern that is consistent (from a sampling view point) with the high observational density of these parameters. Climatological distribution presents a tongue of strong winds and high wind sea extending from the southwest to the northeast and likely resulting from the propagation of high wind waves and swells from the storm formation region in the North Atlantic mid latitudes to the northwest into the subarctic regions. Annual maxima of both sea and swell amount to the values close to 3 m and are identified in the Norwegian Sea. Since the fetch is limited by ice sheets, wind waves gradually dissipate when propagating from the Atlantic northeastward to the Barents Sea. At the same time high swells exceeding 2 m are observed also in the Greenland Sea near the ice margin. Generally the distribution of swell heights is characterized by a more inhomogeneous pattern due to poorer sampling density and complicated conditions of the swell propagation in the region. Nevertheless, a regional pattern of relatively high swells in the Barents Sea originating from both the North Atlantic and the Greenland Sea looks quite realistic.
Annual periods of the wave components (Figure 2c, Figure 2d) are distributed similarly to wave heights pattern, thus showing reliability of the regional wave climatology in general. For wind sea, the 4–6 s periods prevail, which is consistent with e.g. Gulev et al. [2003] and the earlier estimates by Gulev and Hasse [1998]. Swell periods are about 3 s longer, with the corresponding wavelengths of up to 150 m.
Seasonal climatological maps of wind sea and swell heights (Figure 3) demonstrate the patterns largely consistent with stronger storminess in the winter season and decreasing winds in summer. The highest winter seas are observed in the Norwegian Sea where they amount to 3 m (Figure 3a) with swells being up to 3.5 m (Figure 3b) In summer time wind sea heights are typically smaller than 1.5 m with the smallest values of $< 1$ m observed in the coastal areas of the Barents Sea (Figure 3c). Summer swells are characterized by heights of less than 1.5 m with the local maxima exceeding 2 m observed in the northern part of the Barents Sea (Figure 3d). However, these local maxima should be interpreted with caution, potentially in the context of sampling density. Seasonal march of wind sea and swell periods (no figure shown) generally well captures the patterns of the wind sea and swell heights quite well. Wind sea periods in winter vary in the range of 4 to 7 s and swell periods may reach 11 s. In the summer wind sea periods range between 2 and 5 s and swell periods vary from 4 to 8 s.
Armed with the long and homogeneous time series of wave parameters we can derive regional characteristics of variability of wind waves on different time scales. Since the number of missing data in the first two decades of the 20th century is quite high (Figure 1a) and does not allow for developing robust estimates of variability, we have considered a shorter period of 1920–2020 for the analysis of long-term tendencies. For computing variability characteristics we used 5-degree averaging. This allowed to ensure still relatively long time series and to also account for the major geographical features of regional variability.
We used two methods for calculating linear trends in wave characteristics which provided qualitatively consistent results with respect to the sign and slightly quantitatively different magnitudes of the derived trend estimates. Specifically, we applied a non-parametric trend analysis based upon the Theil-Sen estimator [Sen, 1968; Theil, 1950] and the standard least square approach for wind sea and swell heights. Statistical significance of trends was estimated according to a Student t-test at 90% level. The Theil-Sen method reveals slightly smaller estimates of trend values compared to the least square approach. Notably, in the regions with high observational density both estimators provide almost equal results.
 |
| Figure 4 |
Centennial trends in wind sea heights show weakly negative changes over the period between 1920–2020 with the magnitudes amounting to $-2.5$ cm per year ($\sim 1\%$). These trends hold statistical significance over the most of the grid cells. The pattern of statistically significant trends of the opposite sign is observed in the Norwegian Sea close to the coast (Figure 4a). Considering swell heights, the dominant trend is quite opposite, showing positive values over the Norwegian Sea and the Greenland Sea where trends amount to 2.5 cm per year ($<1\%$). Negative swell trends can be found in the Western Barents Sea, but they are mostly insignificant (Figure 4b).
 |
| Figure 5 |
Analysis of regionally averaged estimates of trends for the 100-year period shows that on the centennial scale the trend is superimposed by the strong interdecadal variability represented by the downward tendency over the first part of the record and the upward changes during the recent decades. To quantify this we analyzed the variability of the mean and extreme wave heights in every 5-degree box by estimating the trends over the segments of different duration. Figure 5 shows an example of these estimates for the mean and extreme (evaluated by the 99th percentile of Weibull distribution) wind sea heights in the 1920–2020. As can be seen from the diagram (Figure 5a), the centennial trend of wave heights is weakly positive. However, for the given period, the trends vary dramatically – from the significantly negative values in the beginning and the middle of the 20th century to the pronounced positive trends in the recent decades with some periods showing close to zero values in the 1960s.
The analysis of the 50-year trends (1970–2020) (Figure 4c, (Figure 4d) reveals the pattern which is completely different from the centennial ones (Figure 4a, (Figure 4b). These differences are not so indicative for the wind sea heights which show the enlarged in space pattern of the positive trends in the Norwegian Sea with the stronger magnitudes (Figure 4c). However, the trend pattern for swells demonstrates pronounced changes. Positive trends of up to 1.2 cm per year ($\sim 0.5\%$) are only found in the Svalbard area, while the remaining part of the domain demonstrates statistically significant negative trends amounting to $-2.5$ cm per year ($\sim 1\%$). This transition of the trend pattern emphasizes the importance of considering interdecadal variability superimposed over the linear trend patterns.
Wave climate of the subpolar North Atlantic as well as the Norwegian, Barents, and Greenland Seas has been analyzed on the basis of visual wave observations over the last 120 years. Climatological distributions of wind sea and swell characteristics were derived with $1\mbox{°} \times 1\mbox{°}$ resolution for every calendar month. Linear trends in the wave heights for the 120-year and 50-year periods were obtained using two different estimators. The long-term variability of the wind sea and swell has been found consistent with the large scale pattern earlier revealed by the VOS records for the Northern Hemisphere. For the last 50 years wind seas demonstrate the upward trends with the magnitude of about 0.1–0.4 cm/year, while swells show slightly decreasing trends of $-0.1-0.6$ cm/year. Identified decadal and interannual variability yields a higher magnitude compared to centennial trends. This corresponds with the nature of intrinsic changes being two to three times stronger than secular ones, which was demonstrated in regional wave analyses in Gulev and Grigorieva [2004] and for other modes of long term variability in Gulev et al. [2013].
Badulin, S. I., V. G. Grigorieva (2012) , On discriminating swell and wind-driven seas in voluntary observing ship data, J. Geophys. Res.: Oceans, 117, p. 1–13, https://doi.org/10.1029/2012JC007937.
Badulin, S., V. Grigorieva, et al. (2018) , Wave steepness from satellite altimetry for wave dynamics and climate studies, Russian Journal of Earth Sciences, 18, no. 4, https://doi.org/10.2205/2018ES000638.
Davidan, I. N., L. I. Lopatukhin (1982) , Towards the Storms, 136 pp., Hydrometeoizdat, Leningrad (in Russian).
Freeman, E., S. D. Woodruff, et al. (2017) , ICOADS release 3.0: a major update to the historical marine climate record, Int. J. Climatol., 37, no. 5, p. 2211–2232, https://doi.org/10.1002/joc.4775.
Gavrikov, A., S. K. Gulev, et al. (2020) , RAS-NAAD: 40-year high resolution North Atlantic atmospheric hindcast for multipurpose applications (New dataset for the regional meso-scale studies in the atmosphere and the ocean), J. Appl. Meteor. Climatol., 59, p. 793–817, https://doi.org/10.1175/JAMC-D-19-0190.1.
Grigorieva, V. G., S. I. Badulin (2016) , Wind wave characteristics based on visual observations and satellite altimetry, Oceanology, 56, no. 1, p. 19–24, https://doi.org/10.1134/S000143701601004.
Grigorieva, V. G., S. K. Gulev, A. V. Gavrikov (2017) , Global historical archive of wind waves based on voluntary observing ship data, Oceanology, 57, p. 229–231, https://doi.org/10.1134/S000143701702006.
Grigorieva, V.! G., S. K. Gulev, V. D. Sharmar (2020) , Validating Ocean Wind Wave Global Hindcast with Visual Observations from VOS, Oceanology, 60, no. 1, p. 9–19, https://doi.org/10.1134/S0001437020010130.
Gulev, S. K., L. Hasse (1998) , North Atlantic wind waves and wind stress from voluntary observing data, J. Phys. Oceanogr., 28, p. 1107–1130, https://doi.org/10.1175/1520-0485(1998)028%3C1107:NAWWAW%3E2.0.CO;2.
Gulev, S. K., V. Grigorieva, et al. (2003) , Assessment of the reliability of wave observations from voluntary observing ships: Insights from the validation of a global wind wave climatology based on voluntary observing ship data, J. Geophys. Res.: Oceans Atmos., 108, no. 7, p. 3236–3257, https://doi.org/10.1029/2002JC001437.
Gulev, S. K., V. Grigorieva (2004) , Last century changes in ocean wind wave height from global visual wave data, Geophys. Res. Lett., 31, p. L24302, https://doi.org/10.1029/2004GL021040.
Gulev, S. K., V. Grigorieva (2006) , Variability of the winter wind waves and swell in the North Atlantic and North Pacific as revealed by the Voluntary Observing Ship data, J. Climate, 19, p. 5667–5785, https://doi.org/10.1175/JCLI3936.1.
Gulev, S. K., T. Jung, E. Ruprecht (2007) , Estimation of the impact of sampling errors in the VOS observations on air-sea fluxes. Part II. Impact on trends and interannual variability, J. Climate, 20, p. 302–315, https://doi.org/10.1175/JCLI4008.1.
Gulev, S. K., M. Latif, et al. (2013) , North Atlantic Ocean control on surface heat flux on multidecadal timescales, Nature, 499, p. 464–467, https://doi.org/10.1038/nature12268.
Kent, E. C., N. A. Rayner, et al. (2019) , Observing requirements for long-term climate records at the ocean surface, Front. Mar. Sci., 6, p. 441, https://doi.org/10.3389/fmars.2019.00441.
Khimchenko, E. E., D. I. Frey, E. G. Morozov (2020) , Tidal internal waves in the Bransfield Strait, Antarctica, Russian Journal of Earth Sciences, 20, p. ES2006, https://doi.org/10.2205/2020ES000711.
Lavrova, O. Yu., A. G. Kostianoy, et al. (2011) , Complex Satellite Monitoring of the Russian Seas, 470 pp., IKI RAN, Moscow.
Lopatukhin, L., A. Buhanovskij, et al. (2003) , Reference Data of Wind and Waves Climate of the Barents, Okhotsk, and Caspian Seas. Russian Maritime Register of Shipping, SPB, Saint-Petersburg (in Russian).
Lopatukhin, L., V. Rozhkov, et al. (2002) , The Spectral Wave Climate in the Barents Sea, OMAE2002-28397, 2, p. 283–289, https://doi.org/10.1115/OMAE2002-28397.
Markina, M. Y., A. V. Gavrikov (2016) , Wave climate variability in the North Atlantic in recent decades in the winter period using numerical modeling, Oceanology, 56, p. 320–325, https://doi.org/10.1134/S0001437016030140.
Markina, M., J. Studholme, S. Gulev (2019) , Ocean Wind Wave Climate Responses to Wintertime North Atlantic Atmospheric Transient Eddies and Low-Frequency Flow, J. Climate, 32, p. 5619–5638, https://doi.org/10.1175/JCLI-D-18-0595.1.
Marchenko, A. V., E. G. Morozov (2016) , Surface manifestations of the waves in the ocean covered with ice, Russian Journal of Earth Sciences, 16, p. ES1001, https://doi.org/10.2205/2016ES000561.
Portilla, J., F. O. Torres, J. Monbaliu (2009) , Spectral partitioning and identification of wind sea and swell, J. Atmos. Ocean. Technol., 26, p. 107–122, https://doi.org/10.1175/2008JTECHO609.1.
Reistad, M., O Breivik, et al. (2011) , A high-resolution hindcast of wind and waves for the North Sea, the Norwegian Sea, and the Barents Sea, J. Geophys. Res., 116, p. C05019, https://doi.org/10.1029/2010JC006402.
Saprykina, Y. V., S. Y. Kuznetsov (2018a) , Method of analysis of nonstationary variability of wave climate of Black Sea, J. Phys. Oceanogr., 4, p. 156.
Saprykina, Y., S. Kuznetsov (2018b) , Analysis of the variability of wave energy due to climate changes on the example of the Black Sea, Energies, 11, no. 8, p. 2020, https://doi.org/10.3390/en11082020.
Sen, P. K. (1968) , Estimates of the regression coefficient based on Kendall's tau, Journal of the American Statistical Association, 63, no. 324, p. 1379–1389, https://doi.org/10.1080/01621459.1968.10480934.
Stroeve, J. C., V. Kattsov, et al. (2012) , Trends in Arctic sea ice extent from CMIP5, CMIP3 and observations, Geophys. Res. Lett., 39, no. 16, https://doi.org/10.1029/2012GL052676.
Theil, H. (1950) , A rank-invariant method of linear and polynominal regression analysis (parts 1–3), Ned. Akad. Wetensch. Proc. Ser. A, 53, p. 386–392.
Vignudelli, S., A. G. Kostianoy, P. Cipollini (eds.), et al. (2011) , Coastal Altimetry, 578 pp., Springer-Verlag, Berlin, Heidelberg, https://doi.org/10.1007/978-3-642-12796-0.
Received 20 August 2020; accepted 29 August 2020; published 17 December 2020.

Citation: Grigorieva V., S. K. Gulev (2020), Wave climate in subarctic seas from Voluntary Observing Ships: 1900--2020, Russ. J. Earth Sci., 20, ES14015, doi:10.2205/2020ES000729.
Copyright 2020 by the Geophysical Center RAS.