RUSSIAN JOURNAL OF EARTH SCIENCES, VOL. 20, ES14015, doi:10.2205/2020ES000729, 2020
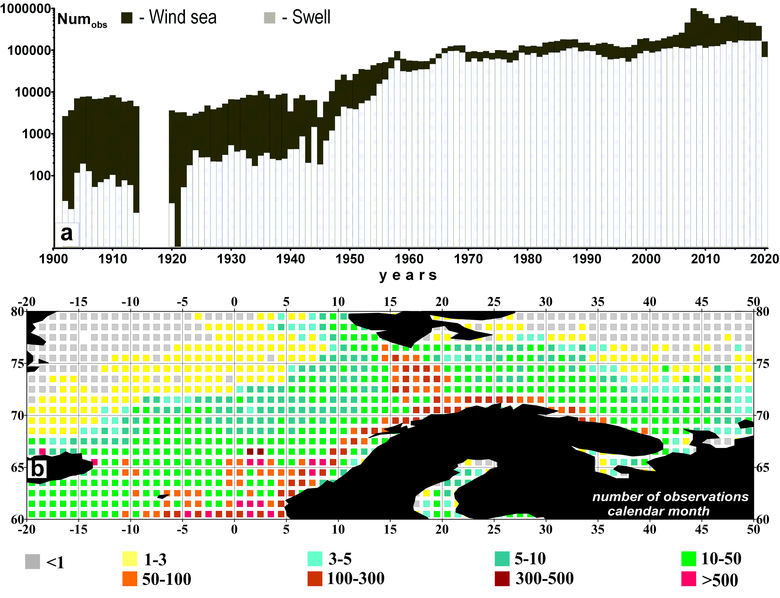
Figure 1. a) temporal distribution of the number of VOS reports containing visually observed wind sea (shown in black) and swell (shown in grey) heights, 1900–2020; b) spatial distribution of the average number of wind sea heights for calendar month, 1900–2020.

![]()
Citation: Grigorieva V., S. K. Gulev (2020), Wave climate in subarctic seas from Voluntary Observing Ships: 1900–2020, Russ. J. Earth Sci., 20, ES14015, doi:10.2205/2020ES000729.
Copyright 2020 by the Geophysical Center RAS.
Generated from LaTeX source by ELXfinal, v.2.0 software package.