
RUSSIAN JOURNAL OF EARTH SCIENCES, VOL. 15, ES3003, doi:10.2205/2015ES000554, 2015
Yu. G. Gatinsky1, T. V. Prokhorova2
1Vernadsky State Geological Museum, Russian Academy of Sciences, Moscow, Russia
2Institute of Earthquake Prediction Theory and Mathematical Geophysics, Russian Academy of Sciences, Moscow, Russia
In consequence of our investigations curried out during 2009–2015 we established the connection of maximal seismic activity in South Siberia, Russian Far East and adjacent countries of central and East Asia with zones divided numerous crust blocks or lithosphere plates and blocks. The investigation was fulfilled with the main purpose of definition the most active interblock zones, distinguishing levels of the maximal seismic energy releasing in them and regularities of its dissipation. Main methods of studying were the analysis of active faults and epicenters distribution with correcting boundaries of blocks and interblock zones, the calculation of the seismic energy volume releasing in these zones with construction of deep seismic sections and graphs of energy dissipation along transects across majority of interblock zones. The most active zones coincide with boundaries such blocks as the Pamirs, Himalayas, Tien Shan, Tarim, Amurian, Japanese–Korean, North Japan, Kuril–Kamchatka and Okhotsk as well as with boundaries between some of these blocks with North Eurasian plate. The volume of energy releasing in mentioned zones reaches up to $1 \times 10^{11-15}$ J, which is not far from the seismic energy releasing in subduction zones between the Pacific plate and Eurasia. Abnormal high seismic energy releasing depends of deep continuation of plate slabs in collision and subduction zones (the Pamirs, Himalayas, Kuril–Kamchatka), intensive displacements along strike-slips and thrusts due to collision processes and deep lithosphere unhomogeneity (Tien Shan, Altai), as well as of sharp changes of geodynamic conditions because of plate movement influence and supposed mantle plumes (North Mongolia, the Baikal Region). The examination of interblock zones is closely connected with the prediction of catastrophic earthquakes' possibility in some regions of central Asia that can be demonstrated at the example of the Kultuk earthquake in South Siberia and some others.
The main influence of the Hindustan–Asian collision on recent geodynamics of central and East Eurasia was first supposed at the last quarter of the past century [Molnar and Tapponnier, 1975; Zonenshain and Savostin, 1981].
The majority of scientists corroborated later this supposing on the base of the fault tectonics analysis and stress fields reconstruction [Gatinsky et al., 2005; San'kov et al., 2011; Shen et al., 2000; Xu and Deng, 1996; Zhang et al., 2011, and many others]. Some researchers restrict the neotectonic influence of the Hindustan–Asian collision only by the south part of central Asia and SE Asia, considering that the greater part of East Asia is under influence of the Pacific Plate subduction [Mordvinova et al., 2015; Rasskasov et al., 2003; Yin, 2010]. Active faults in central and East Asia were in detail characterized by Xu and Deng 1996], Trifonov et al. [2002], Sherman [2014], seismic tomographic data – by Kozhevnikov and Yanovskaya [2005], Chen [2009], Huang et al. [2009], Wang et al. [2013] and others, heat flow (HF) intensity – by Tao and Shen [2008], Lysak [2009], Duchkov et al. [2012]. Numerous Chinese, Russian and western scientists examined in their works up-to-date kinematics of the central Asian crust [Copley, 2008; Flesh et al., 2005; Fu et al., 2002; Gatinsky and Prokhorova, 2014a, Gatinsky et al., 2011a; San'kov et al., 2005; Shen et al., 2000; Shestakov et al., 2011; Timofeev et al., 2006, 2013; Zhao et al., 2010, and others].
Some scientists have already long ago noted "washing away" and the increased penetrating of lithosphere plate's boundaries in central Asia naming them "diffuse boundaries" [Bird, 2003; Gordon, 1998; Stein et al., 2002]. During 2004–2009 authors worked out a problem of up-to-date geodynamic heterogeneity of the Eurasian continent with establishing the North Eurasian Lithosphere Plate (NEP) and some transitional zones between it and neighboring plates [Gatinsky and Rundquist, 2004; Gatinsky et al., 2009; Rundquist et al., 2005]. The problem was decided in the co-authorship with Yu. S. Tyupkin and G. L. Vladova. Transitional zones partly coincide with diffuse boundaries of precursors. Central Asian and East Asian transitional zones were distinguished at boundaries with Indian, Pacific, and Philippine plates. The zones consist of numerous crust's or crust-mantle's blocks limited by active faults, and, what's more, the maximal tectonic activity manifests itself in interblock zones.
Since 2009 we fulfilled the closer definition of the block structure and interblock zones in central Asia. The majority of active faults and epicenters of the strongest earthquakes coincide with these zones, so their detail investigation and correlation with different geophysical fields are important for establishing the level of the seismic activity in this region. Yu. Gatinsky together with co-authors fulfilled for the first time the segmentation of subduction zones in East Asia active continental margins with establishing their different types depending on the slope angle of the Benioff Zone (BZ) and crust type of interacting plates and with counting the seismic energy volume in these zones [Gatinsky and Vladova, 2008; Gatinsky et al., 2000].
The present paper is devoted to examination of seismic active interblock zones in the Asian part of Russia and immediately neighboring countries. The analysis of active faults, lineaments and earthquake epicenters made it possible to establish the continuation of such zones from central parts of Asia, where we earlier investigating them [Gatinsky et al., 2005, 2009, 2011a], to considering territory. Counting the releasing seismic energy was fulfilled within the territory with demonstration its changes in the ArcGIS System by seismic energy isohypses and different colors. Volumes of energy were calculated by the formula from the paper of Kanamori and Andersen [1975]. 16 deep seismic sections and energy dissipation graphs were constructed across majority of 27 active interblock zones. Main features of geology and tectonic position are shown for blocks divided by interblock zones after some publications and field investigations, which Yu. Gatinsky fulfilled at different years in NE and NW China, Transbaikalia, and NE Russia. The special attention was given to up-to-date blocks' and plates' kinematics according to the program of the International Terrestrial Reference Frame (ITRF) and vectors with respect to stable Eurasia, as well as to the analysis of the crust and lithosphere structure under blocks and interblock zones using the base of data on different geophysical fields, including the magnetic field [http://projects.gtk.fi/WDMAM/project/perugia/index.html], gravitational field in the Bouger reduction [http://bgi.omp.obs-mip.fr/index.php/eng/Data-Products/Gravity-Databases/Land-Gravity-data], HF field [Duchkov et al., 2012; Huang et al., 2009; Lysak, 2009; Tao and Shen, 2008], S-waves' velocity field [Kozhevnikov and Yanovskaya, 2005], crust and lithosphere thickness gradients field [http://earthquake.usgs.gov/research/structure/crust/china. php, Sherman, 2012; Teng et al., 2013; Zhang et al., 2011, 2012].
Studying geodynamics and space images gives the possibility to fulfill investigations of 8 regions: 4 west of the Lake Baikal and 4 east of it. The scheme of each region includes active faults, blocks and interblock zones, earthquakes' epicenters and releasing seismic energy volume in isohypses drawing through the 0.5°-step. Schemes were constructed on the base of the Electronic Geodynamic Globe, compiled in the Vernadsky State Geological Museum [http://earth.jscc.ru], one of authors of which was Yu. Gatinsky. The pixels' size of schemes allows enlarging them up to 1:2000000 scale and more, as the majority of figures in this paper.
|
| Figure 1 |
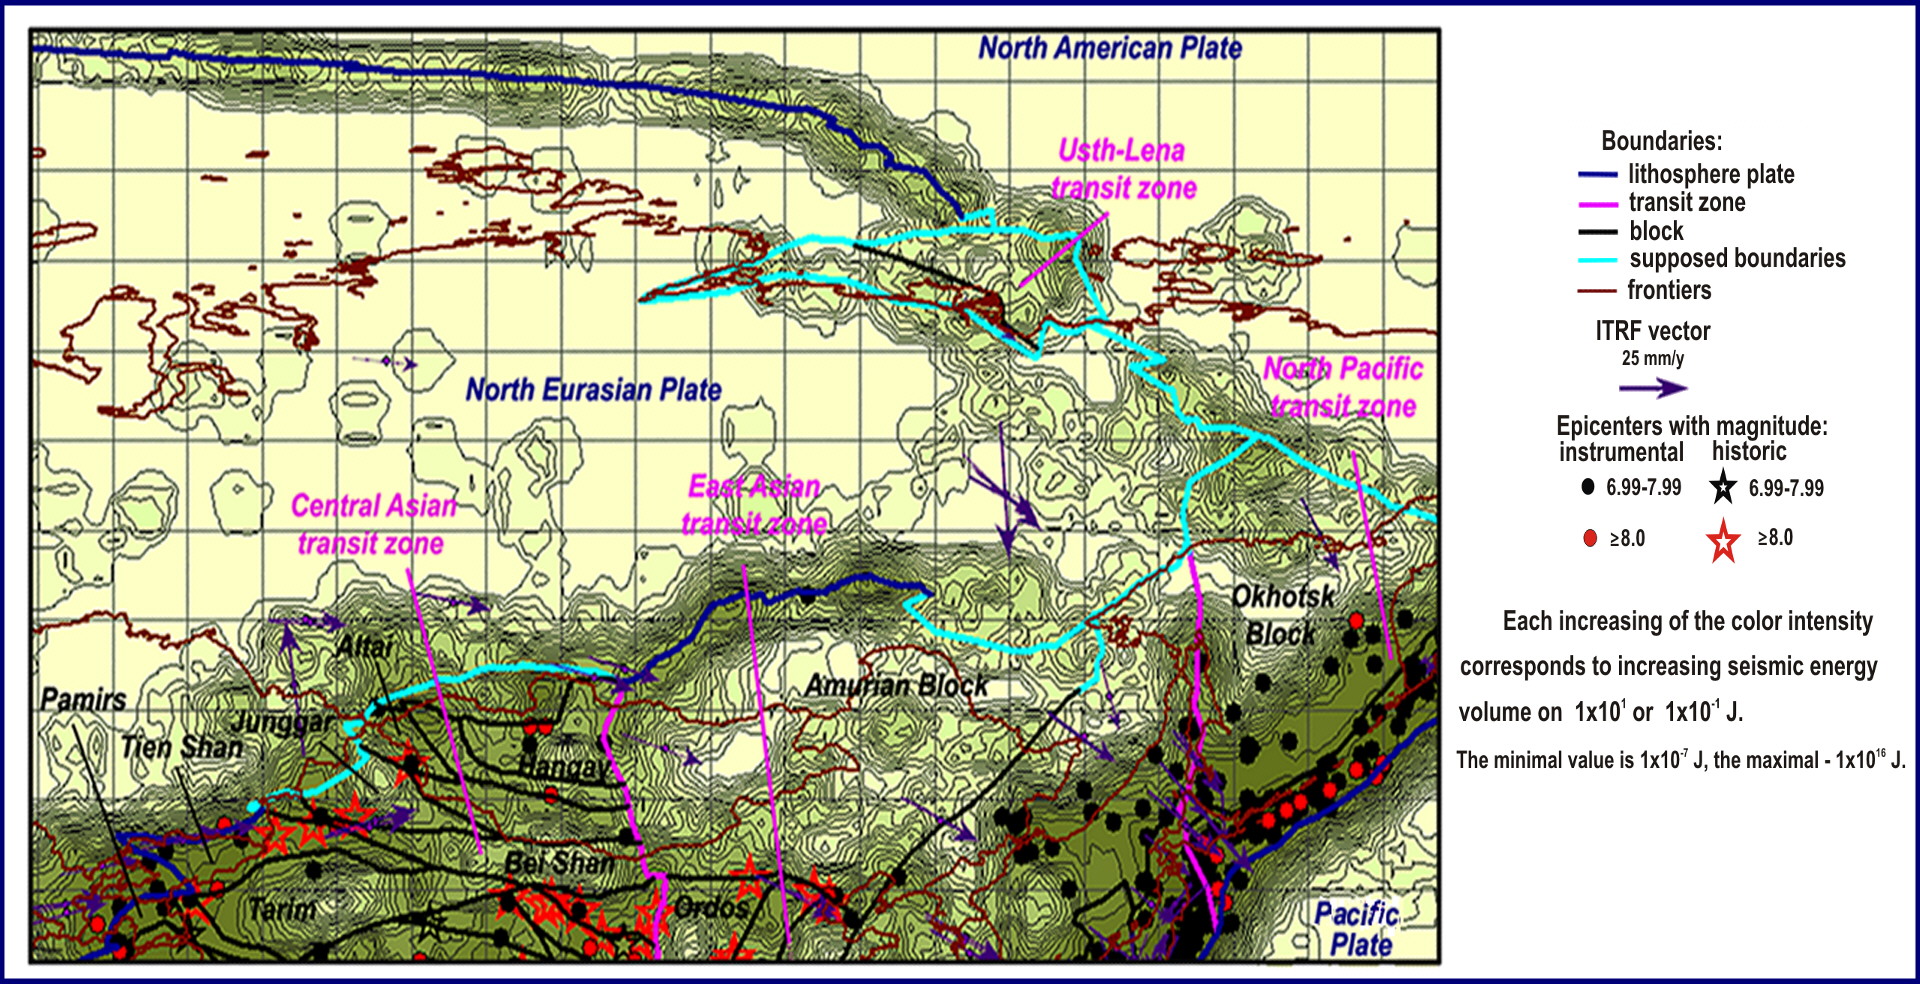
Distinguishing interblock zones within this territory was at first fulfilled in our previous works [Gatinsky et al., 2009, 2011a] at the relatively small scale (Figure 1).
 |
| Figure 2 |
For more detail analysis of these zones we précised block boundaries on the base of data on active faults, and space images' deciphering. The seismicity studying was fulfilled by the analysis of the epicenters' space-timing distribution (as instrumental as historical ones) with magnitude $(M)$ 2.99–8.99 within blocks, at their boundaries, and inside interblock zones after the National Earthquake Information Center (NEIC) 2013 data [http://earthquake.usgs.gov/regional/neic/], as well as tensors of the seismic moment (Figure 2) after the Catalog of the Global Centroid Moment Tensor Project (CMT) 2014 data [http://www.seismology.harvard.edu/] and the seismic energy' space distribution after authors' calculations.
 |
| Figure 3 |
In conclusion of this territory examination we shall discuss block kinematics on the base of space geodetic measuring includes data on as horizontal as vertical displacement as well as the deep structure of examined inner-continental blocks on the base of geophysical fields and programs of lithosphere deep sounding [Huang et al., 2009; Gatinsky and Prokhorova, 2014a, 2014b; Kozhevnikov and Yanovskaya, 2005; Li et al., 2011; Negredo et al., 2007; Zhang et al., 2011, 2012]. The correction and detail analysis of interblock zones' structure were carried out in four regions, including all zones to the west of the Lake Baikal (Figure 3).
We shall consider the most representative from them.
 |
| Figure 4 |
The majority of active faults in the region I (Figure 4) go along the Himalayas, West Kunlun, Tarim, Pamirs, and Tien Shan blocks as well as along boundaries between two latter's with NEP. Interblock zones boundaries mainly coincide with these faults. Zones width is as a rule not more than 80–100 km in both sides from the boundary of blocks or blocks and lithosphere plates. The zone between the Pamirs and NEP includes structures of the Kazakh–Kyrgyz Microcontinent in Uzbekistan and North Tajikistan, which were reworked during the Caledonian epoch. Carbonate-terrigenous and volcanic middle Proterozoic complexes forms its fundament, upper Proterozoic–lower Paleozoic terrigenous deposits–the cover [Khain, 2001]. The zone's length is 504 km, the summary total seismic energy comes to $7.27 \times 10^{15}$ J, and the specific energy – to $1.44 \times 10^{13}$ J. Near latitudinal thrusts to the north and NW right-lateral slips predominate in the zone. Epicenters with $M$ 3.99–6.99, rarely 6.99–8.99 concentrate along these faults. Stress axes have the distinct NE direction [Heidbach et al., 2008].
More south the Pamirs–Himalaya's Zone includes South Pamirs structures, among which in the west the Precambrian massif is composed by high-metamorphosed rocks covered by terrigenous upper Paleozoic and Triassic deposits and crossed by Mesozoic and Cenozoic intrusions. In the east upper Paleozoic–Triassic siliceous-carbonate deposits form fold Indosinides structures discordantly overlain by Cretaceous and Cenozoic molasses. Thrusts with the north vergence predominate as well as slips, left-lateral in the west and right-lateral in the east. Among latter's the largest Karakoram Fault must be mentioned on the boundary of the West Kunlun Block. The displacement along this fault mounts to 52 km and more [Wang et al., 2012]. Stress axes have near longitudinal and NNE direction. The zone's length is 532 km, the volume of the summary total seismic energy comes to $5.43 \times 10^{15}$ J, and the specific energy – to $1.02 \times 10^{13}$ J. Numerous earthquake's epicenters have $M$ 3.99–7.99, rarely 7.99–8.99.
The interblock zone dividing Tien Shan and NEP includes the part of above-mentioned Kazakh–Kyrgyz Microcontinent. The total length of the zone in regions I and II comes to 1421 km, total seismic energy mounts to $5.64 \times 10^{15}$ J, and the specific energy – to $3.97 \times 10^{13}$ J. Near latitudinal thrusts with the right-lateral slip component predominate within the zone thrusting to the north in the west and to the south in the east. NW slips cross and displace these thrusts including the largest Talas–Fergana Fault, which limits the Tien Shan Block in the southwest. Stress axes have mainly longitudinal rarely NNW strikes in the zone. The intensity of the seismic energy is there rather high changing from $1 \times 10^{7}$ to $1 \times 10^{13}$ J (see Figure 4). Seismic events with $M$ 3.99–5.99 predominate; singles have $M$ 5.99–8.99.
The zone between Tien Shan and Tarim gets into the Ist region only by its west part. Caledonian–Hercynian fold complexes compose the zone and are discordantly covered by sediments of the Tarim Platform's north margin [Khain, 2001]. Ophiolites and carbonate-siliceous oceanic deposits of Vendian–Silurian compose the fold system. They are overlain by Devonian and Carboniferous carbonates and flysch with olistostromes, above which the Permian molasse occurs. Numerous thrusts concordant with the structure have mainly the north, rarely south vergence. Right-lateral NW slips have a lesser distribution. Stress axes have the NNW strike in the west and near longitudinal in the east. The total length of the zone stretching through regions I, II, and III mounts to 1683 km, the total energy – to $4.84 \times 10^{16}$ J, and the specific energy – to $2.88 \times 10^{13}$ J. Epicenters with $M$ 3.99–6.99, rarely 7.99–8.99 are wide-spread within the zone.
 |
| Figure 5 |
Data from CMT and NEIC give the possibility drawing transects with deep seismic sections and energy dissipation graphs, which allow determining the energy volume distribution within interblock zones. Relatively non-deep thrusts to the north and north-northeast predominate in the SE part of the 1st transect crossing Pamirs' interblock zones (Figure 5).
They distribute in the zone between the Himalayas and Indian Plate having the right-lateral slip component. The maximal releasing of the seismic energy takes place north in the Pamirs–Himalayas Zone, where it coincides with the distinct seismic focal plane, which steeply sinks to the northwest in the mantle down to 280 km. It is connected most probably with the continuing subduction of the Indian lithosphere under Eurasia [Negredo et al., 2007]. The energy again increases in the transect NNW part, where non-deep right-lateral slips with the thrust's component occur within the Pamirs–NEP Zone. The increasing of the energy volume is fixed on the dissipation graph for each of intersecting zones.
The hypocenter's depth is considerably less in Tien Shan interblock zones on the 3rd transect (Figure 6).
 |
| Figure 6 |
There thrusts to the north predominate in the upper part of the crust within the Tarim–Tien Shan Zone. They have the right-lateral slip component and are replaced in the depth by left-lateral slips with the extension component. Steady thrusts to the north are established again at the depth 28–35 km as well as certain right-lateral and left-lateral slips. Isolated left-lateral slips with the extension component are the deepest (70 km) in this zone. Thrusts to the north and northeast are marked inside the Tien Shan Block south of the Lake Issyk Kul. Normal faults are established in the Tien Shan–NEP Zone after CMT data. Their downthrown north limbs are turned to Tien Shan foothills. On the whole the seismic focal section along the 3rd transect shows distinctly the lamination of the Tien Shan crust that will be examined later in the part 2.4 of our paper. The noticeable increasing of the seismic energy level is fixed on the dissipation graph within booth intersected interblock zones.
The same analysis was fulfilled also for the region II (see Figure 3), but for brevity we confine ourselves only by the short characteristic of seismicity there. Its maximal level mounts to $1 \times 10^{12-13}$ J within Tien Shan–Tarim and Tien Shan–Ebi Nur interblock zones, where earthquakes occur with $M$ up to 6.99–7.99. The energy level decreases north in the Ebi Nur–NEP Zone down to $1 \times 10^{9-5}$ J. The maximal seismic activity along the 4th transect is observed in the north at the depth 17–33 km, where thrusts to the north are developed within the Tarim–Tien Shan Zone. Near there the maximum is fixed on the energy dissipation graph.
 |
| Figure 7 |
The region III is situated between NEP and East Tien Shan including Altai, Junggar, West Mongolia, Bei Shan, partly Sayany, Hangay, and South Gobi blocks (Figure 7).
The most active interblock zones are situated in this region along boundaries between NEP, Altai and West Mongolia as well as between Junggar, Bei Shan and East Tien Shan. The north zone includes late Caledonian complexes of Mountainous Altai and West Sayny represented by metamorphosed Vendian–early Cambrian ophiolites and the spilite-keratophyre formation, Cambrian green tuffs of the andesite-basaltic composition, and the late Cambrian–early Ordovician flysch-like formation. Above them middle Ordovician–Devonian molasses lie discordantly. West in Mining Altai the volcanic-plutonic belt was formed in the middle Devonian–early Carboniferous on the palaeocraton margin [Khain, 2001]. Left-lateral slips having near latitudinal and NW strike together with thrusts to the north and south break these complexes. The level of seismicity in the zone mounts to $1 \times 10^{8-10}$ J with maximal $M$ 6.99–7.99. The Altai–Junggar Zone coincides with the large right-lateral NW Zaysan Fault.
More to the south the Junggar–Bei Shan Zone is composed by continental limnic and carbonaceous deposits of the Junggar Basin cover and folding Hercynian complexes with ophiolites of West Bei Shan and East Tien Shan. They are covered by Permian molasses and broken by thrusts with the south vergence together with near latitudinal right-lateral slips. This zone is one of the most active west of the Lake Baikal with the seismicity level up to $1 \times 10^{10-13}$ J. Earthquakes with $M$ 6.99–8.99 are frequent there.
The majority of hypocenters in the region III are situated within the crust at the depth 8–35 km, how we can see on the deep seismic section along the 7th transect (Figure 8).
 |
| Figure 8 |
NW left-lateral slips predominate at the boundary between NEP and the Sayany Block. South in the Lake District of West Mongolia the local extension is developed. Mainly left-lateral near latitude and NW slips are present in the SW part of the 7th transect at the depth 8–32 km. Maximums of seismic energy releasing coincide with zones between Sayany–Altai and Altai–Junggar blocks. The maximal seismic activity along the transect 6th is observed in Tien Shan–Junggar and Altai–NEP zones, where right-lateral slips and thrusts to the northeast are developed at the depth 10–34 km.
 |
| Figure 9 |
The region embraces the NEP south part, Hangay, partly West Mongolia, South Gobi, and Amurian blocks (Figure 9).
The Sayany–Hangay Zone passes along the east part of West Sayany and through all East Sayany from Kyzyl to Irkutsk in the south part of the Lake Baikal. The zone is composed by slightly metamorphosed late Baikalian complexes of South Siberia, which include folded upper Proterozoic terrigenous-volcanic deposits and ophiolites. Above them Vendian–Cambrian molasses and terrigenous-carbonate deposits lie with unconformity. Granite gneiss cupolas rising from early Precambrian substrate have there the large development [Khain, 2001]. Thrusts to the north predominate in the zone's west part having the left-lateral slip's component. To the east left-lateral slips with the extension component change them [San'kov et al., 2014]. The length of the zone is 636 km, the total energy mounts to $1.86 \times 10^{15}$ J, and the specific energy – to $2.92 \times 10^{12}$ J. The changing of the energy level is noted from $1 \times 10^{1}$ J. to $1 \times 10^{10}$ J. The majority of earthquakes have $M$ 2.99–5.99, rarely 5.99–99.
The Hangay–Sayany Zone has in the northeast the same composition as the previous zone. In the west middle Proterozoic metamorphic rocks of the Hangay Massif basement compose it. Granites of the age 860 Ma years intrude the metamorphic rocks, which are overlain by the upper Proterozoic–Cambrian carbonate-terrigenous complex and crossed by near latitudinal left-lateral slips with the extension component. Transverse near meridional normal faults are developed within the Khubsugul Rift. The majority of stress axes in this and previous zones have the strike, which changes from near longitudinal in the west to north-northeast in the east. The level of seismicity in considering zone is more intensive than in the previous one. The total seismic energy of the Hangay–Sayany Zone, the length of which is 1247 km, mounts to $3.85 \times 10^{15}$ J, and the specific energy – to $3.09 \times 10^{12}$ J. The level of releasing energy changes from $1 \times 10^{4}$ to $1 \times 10^{13}$ J (see Figure 9). The majority of epicenters have $M$ 2.99–6.99, rarely 7.99–8.99.
Left-lateral slips and thrusts to the northeast predominate between South Gobi and West Mongolia blocks as it can be see on the deep seismic section along the 8th transect (Figure 10).
 |
| Figure 10 |
The same non-deep slips occur in the interblock zone between Hangay and West Mongolia, where the level of energy releasing is not more than $1 \times 10^{7}$ J. More intensive energy level up to $1 \times 10^{9-10}$ J characterizes the Hangay–Sayany Zone. Within the Sayany–NEP Zone and inside the Sayany Block left-lateral slips also predominate with single extensions, but the energy level is there below than between Hangay and Sayany blocks (see Figure 10).
Normal faults and left-lateral slips with the extension are developed along the 9th transect in the zone between NEP–Amurian Block near the SW end of the Lake Baikal at the depth 10–16 km. The distinct change of slips on more late normal faults was established within the Baikal Rift System in the Barguzin Trough during the field investigation in the summer of 2008 [Gatinsky et al., 2009]. The maximal increasing of seismic energy dissipation up to $1.4 \times 10^{15}$ J occurs above normal faults bordering the south part of the Lake Baikal. We together with co-authors supposed the possible seismic risk in this territory as far back as 2007–beginning of 2008 [Gatinsky et al., 2008]. Just there near the settlement Kultuk the earthquake with $M$ 6.3 took place in August 2008 corroborating our forecast. The earthquake nearly completely destroys the settlement and damages some roads in the South Baikal Region. West in sides of the Tunka Trough we observed the left-lateral displacement of modern streamlets' thalwegs along NW slips with amplitude up to 10 m [Gatinsky et al., 2009].
The transpressive regime predominates within the west part of the considered territory under influence of the NNE compression from the gigantic Hindustan great lump. Model vectors in respect to stable Eurasia confirm this compression within the Central Asian transit zone (see Figure 1). The comparison of earthquake's mechanisms after CMT data (see Figure 2), model and ITRF vectors [http://itrf.ensg.ign.fr/ITRF_solutions/2008/ITRF2008.php] together with our field observations show there the predominance of thrusts to the north and northeast as well as slips with compression. Just that geodynamic regime causes increasing the seismicity level and blocks' deformation as it can see on the example of Tien Shan. Yu. Gatinsky observed during 2009 field itineraries in East Tien Shan strong zones of Cenozoic thrusts with the north vergence. Same displacements can occur in sufficiently deep levels within the crust and underlying lithosphere mantle, as was stated above in some transects.
Model lateral displacement velocities in respect to the stable Eurasia according to the No Net Rotation Nuvel 1A model (NNR_NUVEL_1A) diminish from 30.6 mm/y in the Lhasa Station near the Hindustan–Eurasia collision zone to 6.7–3.6 mm/y in Urumchi, Bishkek, and Alma-Ata stations. Instrumental measured crust shortening is 2–4 mm/y in NNE thrusts within East Sayany [San'kov et al., 2011]. ITRF vectors of horizontal displacement have mainly east and ENE direction in same stations as well as in the neighboring part of NEP in stations Novosibirsk and Krasnoyarsk with velocities 25.9–31.5 mm/y. Only the single Altai Station north of Usth-Kamenogorsk fixes the displacement to 350° NW with the velocity 50 mm/y (see Figure 1) corroborating different directions of the crust displacement in interblock zones. Maximal uplift velocities mount to 20.5 mm/y south of Tashkent, 2.9 – in Urumchi, and 2.3 – in Krasnoyarsk. The maximal subsidence velocity (8.9 mm/y) is noted in the Altai Station.
Turn our attention to geophysical fields and anomalies of the lithosphere deep structure. Values of the anomalous magnetic field increase up to $(50, 100)$ nT in the boundaries of the majority blocks with NEP (Tien Shan–NEP, Sayany–NEP, Amurian Block–NEP) and diminish down to ($-20, -100$) nT in Tarim–Tien Shan and Altai–West Mongolia zones (World Digital Magnetic Anomaly Map, 2007, http://projects.gtk.fi/WDMAM/project/perugia/index. html.) Negative values down to ($-50, -150$) mGal characterize the majority of investigated interblock zones in gravitational field at the Bouguer Reduction [Bonvalot et al., 2012]. In the Junggar–Altai Zone they are even $-200$ mGal and lesser. HF increases in such zones as Tien Shan–NEP up to 40–80 (here and hereafter in $\mu$W/m$^{-2})$, Altai–NEP – up to 50–90, Sayany–NEP – up to 47–150, in rift zones between Hangay–Sayany and Amurian Block–NEP – up to 80–140 [Duchkov et al., 2012; Lysak, 2009].
Some researches are noting the crust and all lithosphere layering within blocks and interblock zones. The alternation of high and low ohmic zones in the South Tien Shan lithosphere supposes its layering on the basis of magnetotelluric sounding [Rybin, 2011]. The distribution of hypocenters along the 3rd transect (see Figure 6) confirm this layering. The lithosphere has there the reduced thickness 80–90 km in comparison with 200 km under the neighboring part of NEP. Plastic deformations are fixed in the low crust at the depth 30–50 km and the P-wave velocity diminishes down to 7.6–8.0 km/s. in the lithosphere mantle along the Tien Shan–Tarim boundary at the depth 75–80 km. Pushing the low strong lithosphere down Tien Shan along this boundary is confirmed by thrusts to the south (see Figure 2). The most intensive earthquakes are connected with this zone in South Tien Shan, which is characterized by sharp gradients of electric resistance and S-wave velocities [Batalev et al., 2011; Makarov et al., 2010].
Isometric contours (see Figure 1) of S-waves' velocity slowing-down projections $(\leq 4.2-4.25$ km/s$^{-1}$) allow to suppose rising the heated and low dense mantle material from the 100 and 150 km depth to the Earth surface [Kozhevnikov, Yanovskaya, 2005]. High HF values in the Hubsugul Rift (140 $\mu$W/m$^{-2}$) coincide with this anomaly, as well as the large development of young basalts and simultaneous increasing of the seismicity level [Gatinsky et al., 2009; Grachev, 2000; Zhao et al., 2010].
 |
| Figure 11 |
For studying this territory we apply the same succession and methods as for previous (see the 2nd part of the paper). The correction and detail analysis of interblock zones was fulfilled in four regions (Figure 11), for each of which the analysis of the seismic energy intensity and main features of the geological structure was undertaken, in that number by results of field investigations, which were fulfilled in Transbaikalia in 2008 [Gatinsky et al., 2009] as well as earlier in NE China in 1957 and NE Russia in 1958–1962 and 1975 by the same author. As the most representative the regions V and VI will be examined in detail below.
 |
| Figure 12 |
The extending interblock zone dividing NEP and the Amurian Block situates in this region (Figure 12). It is necessary to note that in many previous publications [San'kov et al., 2011; Zonenshain and Savostin, 1981, and others] the Amurian Block was named as the Amurian Lithosphere Plate, but in our opinion it differs from other blocks of central and East Asia only by its dimensions and scarcely can be named as the independent lithosphere plate [Gatinsky et al., 2005]. The investigated zone coincides with the Baikal Rift System, which situates on the boundary between the Siberian Platform and the Baikal–Vitim Fold System with the composite structure. Archean–early Proterozoic metamorphic rocks form the basement of the platform margin in the NW part of the zone and are discordantly overlain by upper Proterozoic–lower Paleozoic terrigenous-carbonate deposits of the platform cover.
Mainly terrigenous upper Proterozoic complexes of the Siberian Craton continental margin compose the SE part of the zone. They were reworked at the end of the Proterozoic and in Paleozoic together with some oceanic and island arc Meso- and Neoproterozoic complexes. All these structures collided with the Siberian Craton in the middle Paleozoic with the simultaneous formation of the gigantic granite batholith [Rytsk et al., 2011]. NE normal faults with the left-lateral slip component predominate within the zone and stress axes have the same direction. The zone continues a long way east outside the limit of the region V. Its total length comes to 2538 km, the summary seismic energy – to $3.33 \times 10^{15}$ J, and the specific energy – to $1.31 \times 10^{12}$ J. The level of releasing energy varies from $1 \times 10^{4}$ to $1 \times 10^{12}$ J. Magnitudes change from 2.99 to 5.99 with certain maximums to 6.99.
 |
| Figure 13 |
A zone of the active extension is distinguished by focal mechanisms within the rift system in the NW part of the 10th transect, which goes through the Buryat Republic, Transbaikalian Krai and its capital Chita (Figure 13). The maximal values of the seismic energy coincide with this zone on the dissipation graph. Some faults within the Amurian Block correspond to near latitudinal slips and thrusts to the southwest [Sherman, Gorbunova, 2011].
 |
| Figure 14 |
The majority of active faults in the region go along borders of Amurian, Japanese–Korean, Kuril–Kamchatka, and North Japan blocks (Figure 14). Practically these faults together with the level of the seismic intensity allow establishing interblock zones between blocks or blocks and lithosphere plates. A zone between Amurian and Japanese–Korean blocks coincides with the continuation of the largest Tanlu fault, which is right-lateral slip at present [Min et al., 2013]. Some geologists suppose, that the east boundary of the Amurian Block (or Plate in other interpretation) passes more easts along the Sakhalin Fault and a segment of the Japanese Subduction Zone [Ashurkov et al., 2011]. But in such interpretation the east part of the south boundary of this structure will cross nearly perpendicularly NNE active faults in the East China Sea and within the Korean Peninsula.
The Amurian Block is composed within its east part by terrigenous-siliceous-volcanic complexes of the Inner Mongolian–Dunbei Fold System, which finished its active development at the end of the Permian and is discordantly overlain by Mesozoic–Cenozoic deposits of the platform cover [Khain, 2001]. The Japanese–Korean Block have the more composite structure. The Sikhote Alinh System includes late Paleozoic ophiolites, Triassic–Jurassic oceanic sediments, early Cretaceous turbidites and olistostromes. Late Cretaceous volcanic rocks form the continental margin belt. Some apophysises of the system divide the Lyaodun Rise of the North Chinese Platform as well as Bureya and Hanka massifs, which are composed by early Precambrian metamorphic rocks $(\geq 2500$ Ma).
The total length of examined interblock zone is more than 3200 km, one third of which situates in the region VI. The summary seismic energy is $6.64 \times 10^{16}$ J, and the specific energy – $2.07 \times 10^{13}$ J. Right-lateral slips predominate there, along which epicenters with $M$ 3.99 concentrate. In the southwest outside the limit of the region magnitudes mount to 6.99. The level of the releasing energy in the regarded part of the zone is not more than $1 \times 10^{-1}$ J. Inside the Amurian Block the specific density of the energy is $(0.15 - 9.5) \times 10^{8}$ J/km$^2$/y. Stress axes strikes are mainly near latitudinal with deflection to the northeast in the Amurian and to the northwest in the Japanese–Korean Block [Heidbach et al., 2008].
A zone between Japanese–Korean and Okhotsk blocks situates within the Sakhalin Island, south of which it is "absorbed" by the subduction zone dipping from the Pacific Plate under Eurasia (see Figure 11). The considering zone includes in the west terrigenous deposits of the Cretaceous–Neogene's forarc with the thickness up to 10 km, in the central part–Mesozoic ophiolites and blue schist's, in the east – the Cretaceous island arc complex. Rocks underwent dislocations at the Pliocene with the formation in the east blanket-thrust structure and the development of high temperature metamorphism [Khain, 2001]. Longitudinal right-lateral slips predominate in the up-to-date structure of the Sakhalin Island. The extent of the interblock zone is 1539 km, 1350 km of which situate within the region VI. The summary energy mounts to $1.49 \times 10^{16}$ J, and the specific energy – to $9.65 \times 10^{12}$ J. Numerous epicenters have $M$ 3.99–4.99, singles – up to 6.99.
Other interblock zones in boundaries of Kuril–Kamchatka, Okhotsk, North Japan and Japanese–Korean blocks are included in the East Asian Subduction Zone. Its seismofocal plane or BZ deeps a long way west outside the limit of mentioned interblock zones and must be regarded as a single whole (see Figure 11). Main components of the subduction zone are: Japanese and Kuril deep water trenches, Kuril Island Arc and the NE part of the Japanese Arc, deep water back arc basins in the Sea of Okhotsk and Sea of Japan. Within the Kuril Arc late Cretaceous and Cenozoic volcanic rocks predominate. In NE Japan volcanic–carbonaceous–turbidite Mesozoic–Cenozoic series overlie old metamorphic rocks of the Hida Complex and in their turn are covered by Quaternary volcanic rocks. Opening the Japanese deep-water basin having the depth up to 3650 m took place at 16–15 Ma ago after rifting within the Eurasian active continental margin, which begun about 21 Ma ago as a result of the anticlockwise turn of NE Japan. This rifting caused the formation along all East Eurasia continental margins the system of pull-apart basins limited by right-lateral slips. Such process was supposingly connected with the collision of Hindustan and Eurasia [Xu et al., 2014].
The total volume of the subduction zone energy mounts to $(11.79 - 15.33) \times 10^{16}$ J [Gatinsky and Vladova, 2008; Gatinsky et al., 2000]. Epicenters with $M$ 3.99–5.99 predominate; in the middle and maximal depth some hypocenters have magnitudes up to 6.99–7.99. Earthquake mechanisms correspond mainly to the extension in the trench, compression in the upper half of BZ, and to trusts and slips in the maximal depth (Figure 15, Figure 16).
 |
| Figure 15 |
The 12th transect crosses at angle the Japanese Trench, the north part of the Honshu Island, the Sea of Japan deep-water basin north of the Yamato Bank, and the part of the continental margin near Vladivostok (see Figure 14). It completely corresponds to BZ deeping down to 600 km. Extensions predominate in the trench changing by left-lateral slips near island arc (see Figure 15). The compression with thrusts to the northwest characterizes the great part of transect within non-volcanic arc in the north of the Honshu Island, where maximums of the energy releasing are noted. Deeper extensions and normal faults predominate in the lithosphere upper mantle. The seismic discontinuity occurs at the depth 175–353 km, lower which the compression and normal faults predominate evidently connected with the slab detachment. North of Vladivostok deep right-lateral slips are developed and in the extreme west near the Russia–China frontier the most deep thrusts and normal faults occur. According to seismic tomography data the slab material accumulation can take place in the wide depression in the base of the upper mantle at the depth 660–685 km [Gu et al., 2012; Schmerr and Thomas, 2011]. The energy distribution along the transect NW part is irregular with maximums within continental margin (see dissipation graph in Figure 15).
 |
| Figure 16 |
The 13th transect goes through South Kuril Islands, Sea of Okhotsk, and North Sakhalin (see Figure 14). As in the previous transect extensions predominate in the Kuril Trench changing by compressions down to 60 km under the modern non-volcanic arc of the Little Kuril Ridge with thrusts mainly to the northwest (see Figure 16). Deeper slips and normal faults prevail within BZ, after which the seismic discontinuities take places at the depth 170–340 and 472–590 km. The new hypocenters condensation under the first discontinuity with combination of normal faults and compression can be connected with the slab detachment. Maximums of energy values in the dissipation graph coincide with non-volcanic arc, the zone of supposed slab detachment, and with the prevalence of the compression near the boundary of the upper and lower mantle at the depth about 600 km. In the northwest of the 13th transect hypocenters at the depth 10–40 km correspond to the large right-lateral slip in the east of Sakhalin and to thrusts in the west.
The same analysis was fulfilled for regions VII and VIII (see Figure 11), but we confine ourselves only by a short characteristic of their interblock zones. In the region VII the highest energy level up to $1 \times 10^{13-14}$ J is noted in the subduction zone deeping from the East Kamchatka sea cost northwest under the Okhotsk Block. There the most intensive earthquakes have $M$ 6.99–8.99 and more. BZ penetrates in the mantle down to the depth 600 km. The extension prevails in the trench, compression – under the Kamchatka Island Arc, slips and normal faults – under the Sea of Okhotsk. The lesser energy level up to $1 \times 10^{4-5}$ J takes place in the region VIII within the deep-water Gakkel Ridge dividing the North American Plate and NEP. Earthquakes have there $M$ up to 5.99–6.99. The level of seismicity decreases down to $1 \times 10^{2} - 1 \times 10^{-2}$ J within the zone separating Usth-Lena and Central Laptev blocks [Gatinsky et al., 2005] from NEP.
 |
| Figure 17 |
Now we take attention to the connection of the seismic activity in the examined territory with blocks kinematics and anomalies of the lithosphere deep structure. The direction of the North American Plate ITRF vector is 157° SE in the Bilibino Station with the velocity of 22.3 mm/y (Figure 17). NEP moves on 121° SE with the velocity of 20 mm/y in the Yakutsk Station, but it is also displaced there south in respect to the stable Eurasia. ITRF vectors within the Amurian Block have mainly southeast azimuths from 106.9–108° in the Ulan-Bator Station with the velocity of 31.2 mm/y up to 121° SE and more in some Chinese stations out of the examined territory limit with velocities 26–35 mm/y [Ye, 2002]. As a whole horizontal displacements in the transtension regime prevail in the southwest of the examined territory resulting in the opening of numerous rifts within the Baikal System, around the Ordos Block, where lithosphere thickness decreases down to 100 km [Bao et al., 2011; Yu et al., 2012], and in boundaries of some other blocks. The prevailing of this regime has different explanations: squeezing some blocks including the Amurian one to the east due to the Hindustan–Eurasia collision [San'kov et al., 2005] or under the action of the deep mantle flow generated by the Pacific slab subduction underneath East Eurasia [Barruol et al., 2008; Parfeevets and San'kov, 2012]; rising some mantle plumes in North Mongolia, East Sayany and in the Lake Baikal region resulting in the crust extension with the rift structures formation and intensive seismicity manifestation [Gatinsky et al., 2009; Grachev, 2000; Zhao et al., 2010].
The Amurian Block undergoes a small anticlockwise turn according to GPS data during 2000–2008 coinciding with the right-lateral displacement along the Tanlu Fault. This turn can cause the modern extension in the Baikal Rift System. The same displacement for the Amurian Block is established by results of the International Tidal Gravitational Section interpretation [Timofeev et al., 2006, 2013]. The velocity of the Amurian Block turn is evaluated as 0.083° per year according to the measuring in the Sikhote Alinh Geodynamic Net [Shestakov et al., 2011]. After the same data the Japanese–Korean Block turns clockwise with the velocity 0.9–1.5 mm/y, what can be resulted in the crust extension and discompaction in the Sunlyao Basin [Wei et al., 2007]. According to ITRF data the Japanese–Korean Block moves to 115–120° SE with the velocity 22–25 mm/y.
Vectors of other blocks within investigated territory (see Figure 17) more differ from the main lithosphere plate displacement. The Okhotsk Block moves to 149° SE in the Magadan Station with the velocity 22.9 mm/y, the north Japan Block – to 132° SE with the velocity 25 mm/y. The vertical upwarping with the velocity 3.7 mm/y is fixed in the ITRF system for the central part of the Honshu Island where the most intensive seismicity occurs. The Pacific Plate displaces to 288° NW with the velocity up to 75 mm/y in respect to stable Eurasia according to NNR_NUVEL_1A model. In the same model the majority of West Pacific island arc also approach to Eurasia (Idzu Bonin, South Kuril and other arcs) by azimuths 290–325° with the velocity 20–39 mm/y what associates with the high seismicity within BZ.
The magnetic field (World Digital Magnetic Anomaly Map, 2007, http://projects.gtk.fi/WDMAM/project/perugia/index.html.)
is characterized east of the Lake Baikal by values increasing up to 100 nT in the west part of the zone between NEP–Amurian Block and by their decreasing down to ($-20, -100)$ nT in the east of this zone and in other interblock zones. Negative values down to ($-50, -150)$ mGal characterize the gravitational field at the Bouguer Reduction in the majority interblock zones [Bonvalot et al., 2012]. The distinct gravitational lineament stretches north east from the Bacbo Gulf and SE China up to the Okhotsk Sea coast near the Shantarskie Islands [Gatinsky and Prokhorova, 2014a, 2014b]. Abrupt negative anomalies down to ($-100, -150)$ mGal predominate west from it and slightly negative to positive ($-50, +50)$ east of it and within the shelf. This change reflects at first the crust thickness decreasing and the lithosphere destruction increasing in the same direction [Sherman, 2012; Teng et al., 2013; Zhang et al., 2011, 2012].
HF is increased in the Amurian Block–NEP Zone near the Lake Baikal up to 80–98 $\mu$W/m$^{-2}$ [Duchkov et al., 2012]. Other heat-flow anomalies are known in the east of the Ordos Block up to 80–160 $\mu$W/m$^{-2}$ and under the boundary of Amurian and Japanese–Korean blocks along the large Tanlu Fault as well as in its flanks up to 80–120 $\mu$W/m$^{-2}$ [Tao and Shen, 2008]. All these sides of the high HF coincide with continental rifts in interblock zones (see Figure 17). Increasing values of HF occur also with the east part of the Sunlyao Basin (The Global Heat Flow Database, 2011, International Heat Flow Commission, University of North Dakota, http://www.heatflow.und.edu/),
where extension and non-compaction of the crust are noted [Wei et al., 2007]. Areas of the HF increasing up to 80–100 $\mu$W/m$^{-2}$ are often concurrent with regions of the young alkaline basalt development as well as with contours of S-waves' velocity slowing-down projections $(\leq 4.2-4.25$ km/s$^{-1}$) at depths 100–300 km [Kozhevnikov and Yanovskaya, 2005] within the Amurian Block and in its boundaries with NEP.
Some researches established well-pronounced dome-shaped features in the crust, which can correlate with upwarping the asthenosphere top. The domes are marked by high HF of 60–90 $\mu$W/m$^{-2}$ with a mantle component higher than the crustal one (30–60 $\mu$W/m$^{-2}$ against 20–30 $\mu$W/m$^{-2}$) and temperatures as high as 800–1100° C at the Moho [Gornov et al., 2009]. It allows supposing upwelling there the warm and non-compact mantel material (plume) to the Earth surface accompanied by the seismicity level increasing [Gatinsky et al., 2009, 2011a; Zhao et al., 2010]. Increasing HF values up to 80 $\mu$W/m$^{-2}$ in the north of the Chukotka Peninsula together with the geothermal gradient about 25–30° per 1000 m and Quaternary alkaline basalt development [Podgornykh, 1997; Sahno and Moiseenko, 2002] also supposes, in our opinion, plume-tectonic processes manifestations.
We have already noted above the layering of the crust and the whole lithosphere within blocks and interblock zones. Decreasing values of the density and ohmic resistance suppose also the deep layering within the Amurian Block lithosphere at 10, 20, 40, and 70–90 km depths [Shevchenko and Kaplun, 2007]. The analysis of deformation axes corresponding to the lengthening (minimal compression) together with data on upper mantle anisotropy shows the possible existing of the strong flow within the upper mantle moving from the northwest to the southeast under SE part of NEP near its boundary with the Amurian Block [San'kov et al., 2011]. This flow causes the NEP clockwise turn fixed by ITRF vectors of the horizontal displacement and can be connected with the Hindustan–Eurasia collision [Xu et al., 2014]. The simultaneous anticlockwise turn of the Amurian Block causes the Baikal Rift opening with the sharp divergence between the block and NEP [Timofeev et al., 2013]. At the same time it must not be excluded the influence plume tectonic processes on geodynamics of the Amurian Block–NEP interblock zone [Gatinsky et al., 2009; Grachev, 2000; Zhao et al., 2010].
The most intensive releasing seismic energy occurs within the investigated territory in zones at boundaries of blocks or blocks and lithosphere plates as in earlier studied regions of central Asia [Gatinsky et al., 2009, 2011a; Sherman, 2014; Sherman et al., 2011]. In the west of the territory the most active zones are the Pamirs–Himalayas, the Pamirs–NEP, Tien Shan–Tarim, and Tien Shan–NEP. The zones go through the territory of Tajikistan, Kirgizia, Uzbekistan, and South Kazakhstan as well as in adjacent parts of Afghan and China. In the east they spread all over SE Russia, Japan, adjacent parts of the Pacific Ocean, Sea of Japan, and Sea of Okhotsk. Volumes of the seismic energy releasing in these zones come to $1 \times 10^{11-15}$ J and in the East Asian Subduction Zone to $1 \times 10^{16}$ J with numerous up-to-date and historical earthquakes with $M$ 5.99–8.99.
Zones with the next seismicity level divide Hangay and Sayany blocks, the Amurian Block and NEP in Russia, Mongolia, and China as well as Japanese–Korean and Okhotsk blocks in the Sakhalin Island. There the energy level comes to $1 \times 10^{7-12}$ J and earthquakes have often $M$ 3.99–6.99, certain up to 6.99–8.99. The more low seismicity level characterizes interblock zones Ebi Nur–Junggar and Altai–Junggar as well as zones at boundaries of these blocks with NEP. These zones go through the territory of East Kazakhstan, the west part of South Siberia and adjacent regions of Mongolia and China. The same level of the seismic activity is noted for the Usth-Lena–central Laptev Zone at the boundary of the North American Plate and NEP. Earthquakes with $M$ 3.99–5.99 are ordinary for these zones, rarely up to 6.99.
It is worth to note that about 80% of the seismic energy occur in the mainland part of East Asia in the seismogenic layer not deeper than 12 km [Teng et al., 2013], but at the same time its maximal volume comes to $2 \times 10^{15}$ J just within the most active interblock zones of Asiatic part of Russia and neighboring countries. As compared with them the volume of the summary total seismic energy in the most active BZ between Pacific and Eurasia comes to $(11.8-15.3) \times 10^{16}$ J [Gatinsky and Vladova, 2008; Gatinsky et al., 2000]. Within central Asia only the Bayanhar–SE China interblock zone is the nearest to these values by the energy volume up to $9.25 \times 10^{16}$ J [Gatinsky et al., 2011a].
The block kinematics and mechanism of earthquakes analysis show the gradual change from the west to east predominant compression from the Pamirs and West Himalayas to Altai and West Sayany by mainly slips in East Sayany and extension within the Baikal Region. It confirms the change in the same direction the transpressive regime by the transtensive one established earlier [Gatinsky et al., 2009; San'kov et al., 2005]. Such change is more than likely connected with predominating of the crust tenuity and extension in East Asia due to the subduction process and mantle anomalies [Zhao et al., 2010].
Investigating lithosphere deep structure anomalies shows the high seismicity connection with BZ within the Himalayas and Pamirs and in the boundary between the Pacific Plate, NEP and some blocks of the East Asian Transitional Zone, with the Gakkel Middle Oceanic Ridge as well as with the lithosphere layering (Tien Shan and Amurian Block), mantle flows and plumes in regions of up-to-date rifting (the Baikal System and others). The obvious coinciding of the high seismicity with relatively narrow interblock zones, which are removed from collision and subduction zones, can be connected with the rigid structure some blocks and their non-adequate response on the stress effect. The problem undoubtedly requires the future examination.
Some results of fulfilled investigations were earlier put into practice in our work devoted to the seismic intensity appraisal in regions of main nuclear and electrical power-stations in Russia and neighboring countries [Gatinsky et al., 2011b].
Ashurkov, S. V., V. A. San'kov, A. I. Miroshnichenko, A. V. Lukhnev, M. P. Sorokin, M. A. Serov, L. M. Byzov (2011), GPS geodetic constrains of the Amurian Plate, Russian Geology and Geophysics, 52, no. 2, p. 239–249, doi:10.1016/j.rgg.2010.12.017.
Bao, X., M. Xu, L. Wang, N. Mi, D. Yu, H. Li (2011), Lithospheric structure of the Ordos Block and its boundary areas inferred from Rayleigh wave dispersion, Tectonophysics, 499, no. 1–4, p. 132–141, doi:10.1016/j.tecto.2011.01.002.
Barruol, G., A. Deschamps, J. Deverchere, V. V. Mordvinova, M. Ulzibat (2008), Upper mantle flow beneath and around the Hangay dome, Central Mongolia, Earth and Planetary Science Letters, 274, no. 1–2, p. 221–233, doi:10.1016/j.epsl.2008.07.027.
Batalev, V. Yu., E. A. Bataleva (2011), The lithospheric structure of the Central and Southern Tien Shan: MTS data correlated with petrology and laboratory studies of lower-crust and upper-mantle xenoliths, Russian Geology and Geophysics, 52, no. 12, p. 1592–1599, doi:10.1016/j.rgg.2011.11.005.
Bird, P. (2003), An Updated Digital Model of Plate Boundaries, Geochemistry, Geophysics, Geosystems, 4, no. 3, p. 1027, doi:10.1029/2001GC000252.
Bonvalot, S., G. Balmino, A. Briais, et al. (2012), World Gravity Map, Scale 1:50000000, BGI-CGMW-CNES-IRD, Paris.
Chen, L. (2009), Lithospheric structure variations between the eastern and central North China Craton from S- and P-receiver function migration, Physics of the Earth and Planetary Interiors, 173, no. 3–4, p. 216–227, doi:10.1016/j.pepi.2008.11.011.
Copley, A. (2008), Kinematics and Dynamics of the Southeastern Margin of the Tibetan Plateau, Geophysical Journal International, 174, no. 3, p. 1081–1100, doi:10.1111/j.1365-246X.2008.03853.x.
Duchkov, A. D., M. N. Zheleznyak, D. E. Ayunov, et al. (2012), Geothermal Atlas of Siberia and Far East (2009–2012), IGM SB RAS, Novosibirsk.
Flesch, L. M., W. E. Holt, P. G. Silver, M. Stephenson, Ch.-Yo. Wang, W. Chan (2005), Constraining the extent of crust-mantle coupling in central Asia using GPS, geologic, and shear wave splitting data, Earth and Planetary Science Letters, 238, no. 1–2, p. 248–268, doi:10.1016/j.epsl.2005.06.023.
Fu, Y., W. Zhu, X. Wang, W. Duan, W. Jiao (2002), Pre-sent-day crustal deformation in China relative to ITRF1997 kinematic plate model, Journal of Geodesy, 76, no. 4, p. 216–225, doi:10.1007/s00190-001-0232-7.
Gatinsky, Yu. G., G. L. Vladova, V. V. Rozhkova (2000), Se-ismicity and Metallogeny of Convergent Plate Boundaries in Subduction Zones, Doklady Earth Sciences, 371A, no. 3, p. 583–587.
Gatinsky, Yu. G., D. V. Rundquist (2004), Geodynamics of Eurasia: Plate Tectonics and Block Tectonics, Geotectonics, 38, no. 1, p. 1–16.
Gatinsky, Yu. G., D. V. Rundquist, Yu. S. Tyupkin (2005), Block Structure and Kinematics of Eastern and Central Asia from GPS Data, Geotectonics, 39, no. 5, p. 333–348.
Gatinsky, Yu. G., G. L. Vladova (2008), Subduction zones of SE Asia: main types, seismicity and mineralization, Proceedings of the VAG International Symposium 2008, 7–9 November, Hanoi, Vietnam. Special issue of Journal of Geology: International Year of Planet Earth, http://idm.gov.vn/nguon_luc/Xuat _ban/2008/b31-32/b9.htm, p. 9–16, Special issue of Journal of Geology, Hanoi, Vietnam.
Gatinsky, Yu., T. Prokhorova, D. Rundquist, G. Vladova (2009), Zones of Catastrophic Earthquakes of Central Asia: Geodynamics and Seismic Energy, Russian Journal of Earth Sciences, 11, p. ES1001, doi:10.2205/2009ES000326.
Gatinsky, Yu., D. Rundquist, G. Vladova, T. Prokhorova (2011a), Up-to-date geodynamics and seismicity of Central Asia, International Journal of Geosciences, 2, no. 1, p. 1–12, doi:10.4236/ijg.2011.21001.
Gatinsky, Yu., D. Rundquist, G. Vladova, T. Prokhorova (2011b), Seismic-Geodynamic Monitoring of Main Electric Power-Stations in East Europe and North Asia, International Journal of Geosciences, 2, no. 2, p. 75–83, doi:10.4236/ijg.2011.22008.
Gatinsky, Yu. G., T. V. Prokhorova (2014a), Superficial and Deep Structure of Central Asia as Example of Continental Lithosphere Heterogeneity, Universal Journal of Geoscience, 2, no. 2, p. 43–52.
Gatinsky, Yu. G., T. V. Prokhorova (2014b), Reflection of central Asia block structure in modern geophysical fields, Convention & 11th International Conference on Gondwana to Asia, Beijing, China, Sept. 20–21, 2014. IAGR Conference Series, No. 20, Astract Volume, p. 27–30, China University of Geosciences, Beijing, China.
Gordon, R. G. (1998), The Plate Tectonic Approximation: Plate Nonrigidity, Diffuse Plate Boundaries, and Global Plate Reconstructions, Annual Review of Earth and Planetary Sciences, 26, no. 1, p. 615–642, doi:10.1146/annurev.earth.26.1.615.
Gornov, P. Yu., M. V. Goroshko, Yu. F. Malyshev, V. Ya. Podgornyi (2009), Thermal structure of lithosphere in Central Asia and Pacific belts and their adjacent cratons, from data of geoscience transects, Russian Geology and Geophysics, 50, no. 5, p. 485–499, doi:10.1016/j.rgg.2008.10.001.
Grachev, A. F. (2000), Modern Volcanism, Mantle Plumes, and Their Connection with the Stress Intensity in the Lithosphere, Neotectonics, Geodynamics and Seismicity of Northern Eurasia, p. 245–266, Probel, Moscow (in Russian with English Summary).
Gu, Yu. J., A. Okeler, R. Schultz (2012), Tracking slabs beneath northwestern Pacific subduction zones, Earth and Planetary Science Letters, 331–332, p. 269–280, doi:10.1016/j.epsl.2012.03.023.
Heidbach, O., M. Tingay, A. Barth, J. Reinecker, D. Kurfess, B. Mler (eds.) (2008), World Stress Map, A Project of the Heidelberg Academy of Sciences and Humanities, Commission for the Geological Map of the World, WSM Release 2008, http://www.world-stress-map.org, Academy of Sciences and Humanities, Heidelberg.
Huang, J., D. Zhao (2009), Seismic imaging of the crust and upper mantle under Beijing and surrounding regions, Physics of the Earth and Planetary Interiors, 173, no. 3–4, p. 330–348, doi:10.1016/j.pepi.2009.01.015.
Huang, Zh., L. Wang, D. Zhao, N. Mi, M. Xu (2011), Seismic anisotropy and mantle dynamics beneath China, Earth and Planetary Science Letters, 306, no. 1–2, p. 105–117, doi:10.1016/j.epsl.2011.03.038.
Kanamori, H., D. L. Andersen (1975), Theoretical Basis of Some Empirical Relations in Seismology, Bulletin of the Seismological Society of America, 65, p. 1073–1095.
Khain, V. E. (2001), Tectonics of Continents and Oceans (Year 2000), 606 pp., Scientific World, Moscow (in Russian with English Summary).
Kozhevnikov, V. M., T. B. Yanovskaya (2005), S-wave velocities distribution in the lithosphere of the Asian continent after data of surface Rayleigh waves, Actual Problems of Modern Geodynamics of Central Asia, edited by K. G. Levi and S. I. Sherman, p. 46–64, Siberian Branch RAS, Novosibirsk (in Russian, with English Abstract).
Li, Yu., Yu. Yang (2011), Gravity data inversion for the lithospheric density structure beneath North China Craton from EGM 2008 model, Physics of the Earth and Planetary Interiors, 189, no. 1–2, p. 9–26, doi:10.1016/j.pepi.2011.09.004.
Lysak, S. V. (2009), Thermal history, geodynamics, and current thermal activity of lithosphere in China, Russian Geology and Geophysics, 50, no. 9, p. 815–825, doi:10.1016/j.rgg.2009.08.007.
Makarov, V. I., D. V. Alekseev, V. Y. Batalev, A. K. Rybin, G. G. Shchelochkov (2010), Underthrusting of Tarim beneath the Tien Shan and deep structure of their junction zone: Main results of seismic experiment along MANAS Profile Kashgar-Song-Köl, Geotectonics, 44, no. 2, p. 102–126, doi:10.1134/S0016852110020020.
Min, W., Yu. Liu, D. Jiao, J. Shen, X. Pan (2013), Evidence for Holocene activity of the Yilan-Yitong fault, northeastern section of the Tan-Lu fault zone in Northeast China, Journal of Asian Earth Sciences, 67–68, p. 207–216, doi:10.1016/j.jseaes.2013.02.031.
Molnar, P., P. Tapponier (1975), Cenozoic Tectonics of Asia: Effects of a Continental Collision, Science, 189, no. 4201, p. 419–426, doi:10.1126/science.189.4201.419.
Mordvinova, V. V., A. V. Treussov, E. Kh. Turutanov (2015), Nature of the Mantle Plume under Hangai (Mongolia) Based on Seismic and Gravimetric Data, Doklady Earth Sciences, 460, no. 1, p. 92–95, doi:10.1134/S1028334X15010201.
Negredo, A. M., A. Replumaz, A. Villaseñor, S. Guillot (2007), Modeling the evolution of continental subduction processes in the Pamir-Hindu Kush region, Earth and Planetary Science Letters, 259, no. 1–2, p. 212–225, doi:10.1016/j.epsl.2007.04.043.
Parfeevets, A. V., V. A. Sankov (2012), Late Cenozoic tectonic stress fields of the Mongolian microplate, Comptes Rendus Geoscience, 344, no. 3–4, p. 227–238, doi:10.1016/j.crte.2011.09.009.
Podgornykh, L. V. (1997), Heat Flow Map of Arctic Regions, Scale 1:30000000, Nedra, Moscow (in Russian).
Rasskazov, S. V., J. F. Luhr, S. A. Bowring, et al. (2003), Late Cenozoic volcanism in the Baikal rift system: Evidence for formation of the Baikal and Khubsugul basins due to thermal impacts on the lithosphere and collision-derived tectonic stress, Berliner Paläobiologische Abhandlungen, no. 4, p. 33–48.
Rundkvist, D. V., Yu. G. Gatinsky, W. A. Bush, V. G. Kossobokov (2005), The area of Russia in the present-day structure of Eurasia: Geodynamics and seismicity, Computational Seismology and Geodynamics, 7, edited by D. K. Chowdhury, p. 224–233, American Geophysical Union, Washington D. C.
Rybin, A. K. (2011), Deep Structure and Up-to-Date Geodynamics of Central Tien Shan After Magnetotelluric Sounding Results, 272 pp., Nauchnyi Mir, Moscow (in Russian with English Summary).
Rytsk, E. Yu., V. P. Kovach, V. V. Yarmolyuk, E. S. Bogomolov, V. I. Kovalenko, A. V. Kotov (2011), Isotopic Structure and Evolution of the Continental Crust in the East Transbaikalian Segment of the Central Asian Fold belt, Geotectonics, 45, no. 5, p. 349–377, doi:10.1134/S0016852111050037.
Sahno, V. G., V. G. Moiseenko (2002), Plume volcanicity of continental margins of East Asia, Mantle Plumes and Metallogeny, edited by A. F. Grachev, p. 438–441, Centre of Geophysical Investigations, Petrozavodsk–Moscow.
San'kov, V. A., A. V. Lukhnev, N. A. Radziminovich, et al. (2005), A Quantitative estimate of modern deformations of the Earth's crust in the Mongolian block (Based on GPS-geodesy and seismotectonic data), Doklady Earth Sciences, 403, p. 946–949.
San'kov, V. A., A. V. Lukhnev, A. V. Parfeevets, et al. (2011), Coupling of the Crustal and Upper Mantle Deformations in the Mongolia–Siberian Mobile Area, Doklady Earth Sciences, 436, no. 1, p. 159–164, doi:10.1134/S1028334X11010302.
San'kov, V. A., A. V. Lukhnev, A. I. Miroshnichenko, et al. (2014), Contemporary Horizontal Movements and Seismicity of the South Baikal Basin (Baikal Rift System), Izvestiya, Physics of the Solid Earth, 50, no. 6, p. 785–794, doi:10.1134/S106935131406007X.
Schmerr, N., C. Thomas (2011), Subducted lithosphere beneath the Kuriles from migration of PP precursors, Earth and Planetary Science Letters, 311, no. 1, p. 101–111, doi:10.1016/j.epsl.2011.09.002.
Shen, Z., C. Zhao, A. Yin, Y. Li, D. D. Jackson, P. Fang, D. Dong (2000), Contemporary Crustal Deformation in East Asia Constrained by Global Positioning System Measurements, Journal of Geophysical Research, 105, no. B3, p. 5721–5734, doi:10.1029/1999JB900391.
Sherman, S. I., E. A. Gorbunova (2011), The genesis of seismic activity on faults in Central Asia in real time and its variations, Journal of Volcanology and Seismology, 5, no. 1, p. 60–72, doi:10.1134/S0742046311010076.
Sherman, S. I., A. P. Sorokin, A. T. Sorokina, E. A. Gorbunova, V. A. Bormotov (2011), New Data on the Active Faults and Zones of Modern Lithosphere Destruction in the Amur Region, Doklady Earth Sciences, 439, no. 2, p. 1146–1151, doi:10.1134/S1028334X11080186.
Sherman, S. I. (2012), Destruction of the lithosphere: Fault-block divisibility and its tectonophysical regularities, Geodynamics & Tectonophysics, 3, no. 4, p. 315–344, doi:10.5800/GT-2012-3-4-0077.
Sherman, S. I. (2014), Seismic Process and Earthquake Forecasting: Tectonophysics Conception, 359 pp., Geo, Novosibirsk (in Russian with English Summary).
Shestakov, N., M. Gerasimenko, H. Takahashi, et al. (2011), Present tectonics of the southeast of Russia as seen from GPS observations, Geophysical Journal International, 184, no. 2, p. 529–540, doi:10.1111/j.1365-246X.2010.04871.x.
Shevchenko, B. F., V. B. Kaplun (2007), The deep geodynamic model of the Euroasian and Amur lithospheric plates junction area, Lithosphere, no. 4, p. 3–20 (in Russian with English Abstract).
Stein, S., G. F. Sella, E. A. Okal (2002), The January 26, 2001 Bhuj earthquake and the diffuse western boundary of the Indian Plate, Plate Boundary Zones, edited by S. Stein and J. T. Freymueller, p. 243–254, American Geophysical Union, Geodynamics Series, Washington D. C.
Tao, W., Z. Shen (2008), Heat flow distribution in Chinese continent and its adjacent areas, Progress in Natural Science, 18, no. 7, p. 843–849, doi:10.1016/j.pnsc.2008.01.018.
Teng, J., Ya. Deng, J. Badal, Yo. Zhang (2013), Moho depth, seismicity and seismogenic structure in China mainland, Tectonophysics, 627, p. 108–121, doi:10.1016/j.tecto.2013.11.008.
Timofeev, V. Yu., D. G. Ardyukov, P. Y. Gornov, B. Ducarme, M. Everaerts, V. A. Parovishnii, M. Frid (2006), GPS and tidal method for geodynamic study in Siberia and in Far East of Russia, Space Geodesy and Dynamics Planet. Proceed. APSG Symposium, 16–18 October, 2006, Korea, Asia-Pacific Space Geodynamics Program, APSG, Shanghai.
Timofeev, V., R. Kulinich, M. Valitov, et al. (2013), Coseismic effects of the 2011 Magnitude 9.0 Tohoku-Oki Earthquake measured at Far East Russia continental coast by gravity and GPS methods, International Journal of Geosciences, no. 4, p. 362–370, doi:10.4236/ijg.2013.42034.
Trifonov, V. G., O. V. Soboleva (2013), Recent Geodynamics of the Alpine-Himalayan Collision Belt, Transactions of the Geological Institute RAS, 541, edited by Yu. G. Leonov, p. 225, GEOS, Moscow (in Russian with English Summary).
Wang, S., Ch. Wang, R. J. Phillips, M. A. Murphy, X. Fang, Ya. Yue (2012), Displacement along the Karakoram fault, NW Himalaya, estimated from LA-ICP-MS U–Pb dating of offset geologic markers, Earth and Planetary Science Letters, 337–338, p. 156–163, doi:10.1016/j.epsl.2012.05.037.
Wang, S., F. Niu, G. Zhang (2013), Velocity structure of the uppermost mantle beneath East Asia from Pn tomography and its dynamic implications, Journal of Geophysical Research: Solid Earth, 118, no. 1, p. 290–301, doi:10.1002/jgrb.50085.
Wei, W., G. Ye, Y. Li, S. Jin, M. Deng, J. Jing (2007), Three-Dimensional P-Wave Velocity Structure of the Crust of North China, Journal of China University of Geosciences, 18, no. 3, p. 257–268, doi:10.1016/S1002-0705(08)60006-0.
Xu, X., Q. Deng (1996), Nonlinear Characteristics of Paleoseismicity in China, Journal of Geophysical Research, 101, no. B3, p. 6209–6231, doi:10.1029/95JB01238.
Xu, J., Z. Ben-Avraham, T. Kelty, H.-S. Yu (2014), Origin of marginal basins of the NW Pacific and their plate tectonic reconstructions, Earth-Science Reviews, 130, p. 154–196, doi:10.1016/j.earscirev.2013.10.002.
Ye, S. (2002), Progress on APSG, Proceeding of International Seminar on the Use of Space Techniques for Asia-Pacific Regional Crustal Movements Studies, Irkutsk, Russia, Aug. 5–10, 2002, edited by S. Tatevian, p. 6–14, Asia-Pacific Space Geodynamics Project, GEOS, Moscow.
Yin, A. (2010), Cenozoic tectonic evolution of Asia: A preliminary synthesis, Tectonophysics, 488, no. 1–4, p. 293–325, doi:10.1016/j.tecto.2009.06.002.
Yu, Ch.-Q., W.-P. Chen, J.-Yu. Ning, et al. (2012), Thick crust beneath the Ordos plateau: Implications for instability of the North China craton, Earth and Planetary Science Letters, 357–358, p. 366–375, doi:10.1016/j.epsl.2012.09.027.
Zhang, Zh., Q. Chen, Zh. Bai, Yo. Chen, J. Badal (2011), Crustal structure and extensional deformation of thinned lithosphere in Northern China, Tectonophysics, 508, no. 1–4, p. 62–72, doi:10.1016/j.tecto.2010.06.021.
Zhang, Zh., J. Wu, Ya. Deng, J. Teng, X. Zhang, Yu. Chen, G. Panza (2012), Lateral variation of the strength of lithosphere across the eastern North China Craton: New constraints on lithospheric disruption, Gondwana Research, 22, no. 3–4, p. 1047–1059, doi:10.1016/j.gr.2012.03.006.
Zhao, D., F. Pirajno, N. L. Dobretsov, L. Liu (2010), Mantle structure and dynamics under East Russia and adjacent regions, Russian Geology and Geophysics, 51, no. 9, p. 925–938, doi:10.1016/j.rgg.2010.08.003.
Zonenshain, L. P., L. A. Savostin (1981), Geodynamics of the Baikal Rift Zone and Plate Tectonics of Asia, Tectonophysics, 76, no. 1–2, p. 1–45, doi:10.1016/0040-1951(81)90251-1.
Received 4 September 2015; accepted 4 September 2015; published 4 September 2015.

Citation: Gatinsky Yu. G., T. V. Prokhorova (2015), Seismic active zones in South Siberia, Russian Far East, and adjacent countries, Russ. J. Earth Sci., 15, ES3003, doi:10.2205/2015ES000554.
Copyright 2015 by the Geophysical Center RAS.