RUSSIAN JOURNAL OF EARTH SCIENCES, VOL. 15, ES3003, doi:10.2205/2015ES000554, 2015
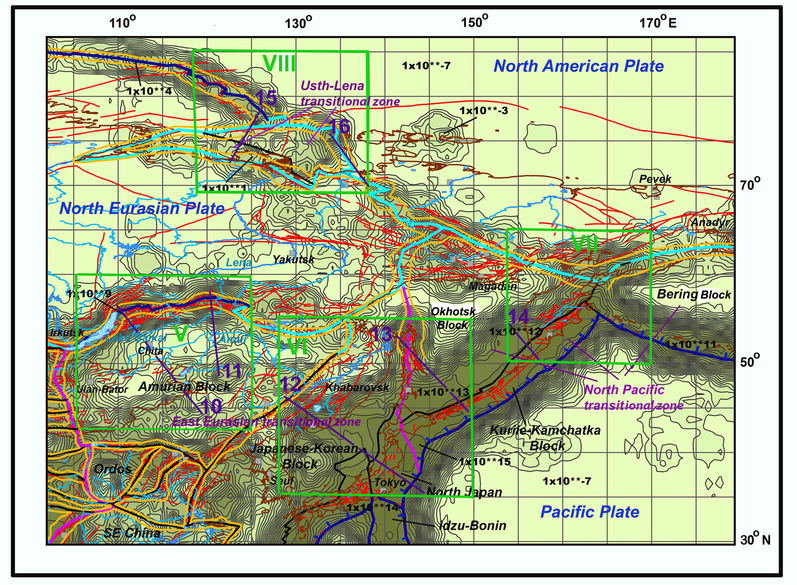
Figure 11. Main regions of up-to-date seismic and tectonic activity east of the Lake Baikal. Green line – region' boundary, violet – transect. Red line – active fault. Blue line with hachures – subduction zone' upper boundary. Isohypses show volumes of seismic energy releasing. Each increasing color intensity corresponds to increasing energy volume on $1 \times 10^{1}$ J or $1 \times 10^{-1}$ J. The minimal value is $1 \times 10^{-7}$ J, the maximal – $1 \times 10^{16}$ J. Some values of energy volume are written. Other captions see in Figure 1.

![]()
Citation: Gatinsky Yu. G., T. V. Prokhorova (2015), Seismic active zones in South Siberia, Russian Far East, and adjacent countries, Russ. J. Earth Sci., 15, ES3003, doi:10.2205/2015ES000554.
Copyright 2015 by the Geophysical Center RAS.
Generated from LaTeX source by ELXpaper, v.1.3 software package.