RUSSIAN JOURNAL OF EARTH SCIENCES, VOL. 19, ES6003, doi:10.2205/2019ES000695, 2019
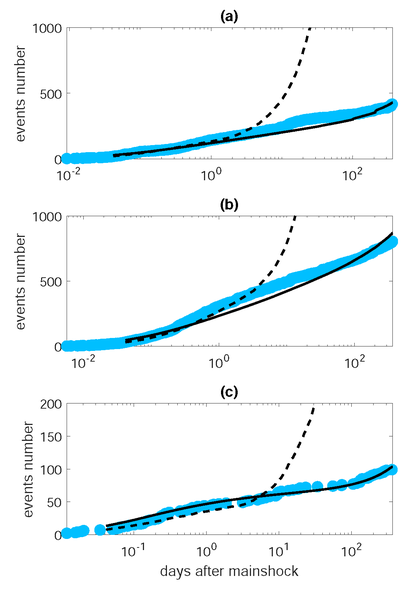
Figure 2. Cumulative number of seismic events for three aftershock sequence, real and forecasted by models ETAS and EP. (a) – 27 February 2010, Mw=8.8, Chile earthquake, (b) – 11 March 2011, Mw=9.1, Tohoku earthquake, (c) – 11 April 2012, Mw=8.6, Sumatra earthquake. Circles show the real cumulative number of event of magnitude $M\geq6.5$ (Tohoku) and $M\geq6.0$ (Chile and Sumatra), dashed line the average for 2500 catalogue simulation of the ETAS model, solid line average for 2500 catalogue simulation of the EP model. Parameters for both models have been estimated in the interval (0.05,2) days afters the corresponding large eartquakes, their value are given in Table 1.

![]()
Citation: Baranov S. V., A. D. Gvishiani, C. Narteau, P. N. Shebalin (2019), Epidemic type aftershock sequence exponential productivity, Russ. J. Earth Sci., 19, ES6003, doi:10.2205/2019ES000695.
Copyright 2019 by the Geophysical Center RAS.
Generated from LaTeX source by ELXfinal, v.2.0 software package.