RUSSIAN JOURNAL OF EARTH SCIENCES, VOL. 19, ES6005, doi:10.2205/2019ES000692, 2019
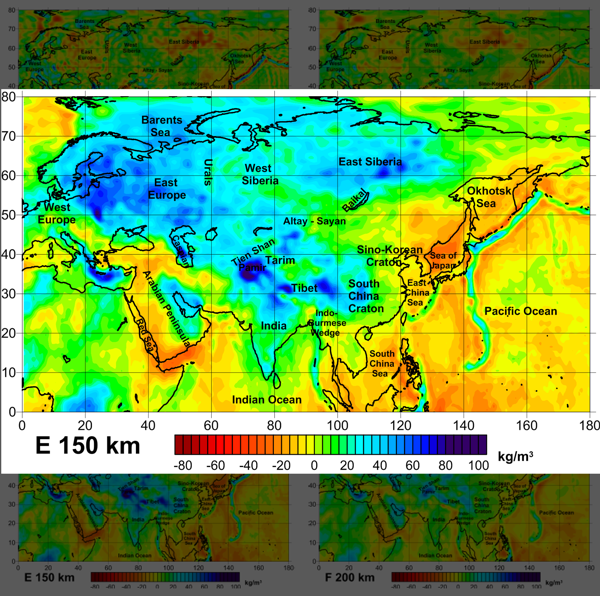
Figure 6. Density variations in the upper mantle at depths of 100, 150, and 200 km according to the constructed 3D density model. A, B, and C represent calculated corrections to the initial model in Figure 5; D, E, and F ñ final model obtained in the inversion. Editorial note: To zoom selected image click on the corresponding capital letter in blue color, click on Go back to view all panels.

![]()
Citation: Kaban Mikhail K., Roman I. Krasnoperov, Anatoly A. Soloviev, Yulia I. Nikolova (2019), The integrative density model of the crust and upper mantle of Eurasia: representation in GIS environment, Russ. J. Earth Sci., 19, ES6005, doi:10.2205/2019ES000692.
Copyright 2019 by the Geophysical Center RAS.
Generated from LaTeX source by ELXfinal, v.2.0 software package.