RUSSIAN JOURNAL OF EARTH SCIENCES, VOL. 19, ES2005, doi:10.2205/2019ES000654, 2019
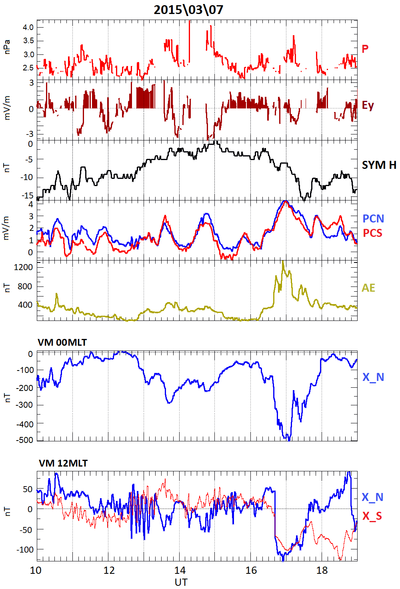
Figure 3. A plot of the VM showing dayside IPCL pulsation suppression during a nightside substorm on 7 March 2015 (10:00–19:00 UT). The format is the same as in Figure 1.

![]()
Citation: Kozyreva O. V., V. A. Pilipenko, A. A. Soloviev, M. J. Engebretson (2019), Virtual magnetograms – a tool for the study of geomagnetic response to the solar wind/IMF driving, Russ. J. Earth Sci., 19, ES2005, doi:10.2205/2019ES000654.
Copyright 2019 by the Geophysical Center RAS.
Generated from LaTeX source by ELXpaper, v.2.0 software package.