RUSSIAN JOURNAL OF EARTH SCIENCES, VOL. 19, ES2005, doi:10.2205/2019ES000654, 2019
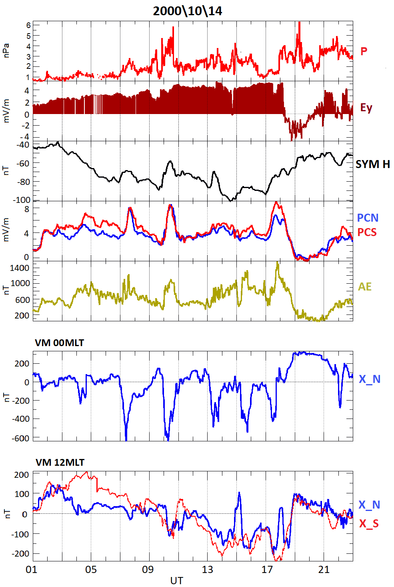
Figure 1. A plot of the VM showing the basic space weather parameters: solar wind dynamic pressure $P$, electric field $E_y=-V \times B_z$, SYMH-index, PCN/PCS indices, $AE$-index, and the $X$ component of virtual magnetograms of the geomagnetic response at the noon-cusp region (12:00 MLT) and the midnight auroral region (00:00 MLT) for the Northern (blue line) and Southern (red line) hemispheres during the sawtooth event of 14 October 2000 (01:00–23:00 UT).

![]()
Citation: Kozyreva O. V., V. A. Pilipenko, A. A. Soloviev, M. J. Engebretson (2019), Virtual magnetograms – a tool for the study of geomagnetic response to the solar wind/IMF driving, Russ. J. Earth Sci., 19, ES2005, doi:10.2205/2019ES000654.
Copyright 2019 by the Geophysical Center RAS.
Generated from LaTeX source by ELXpaper, v.2.0 software package.