
RUSSIAN JOURNAL OF EARTH SCIENCES, VOL. 18, ES1003, doi:10.2205/2018ES000620, 2018
Shivangi Bhardwaj1, Parvaiz A. Khan2, Roshni Atulkar1, P. K. Purohit1
1National Institute of Technical Teachers' Training & Research, Bhopal, MP, India
2Department of Physics, Islamic University of Science and Technology, Awantipora, J&K, India
In the present paper, we have studied the geo-effective characteristics of halo coronal mass ejections (CMEs) and examined their distribution over three kinds of geo-effective properties. To accomplish this study, we have selected the halo CMEs that were observed during the solar cycle 23, i.e. from 1996 to 2007. We selected three properties of CMEs viz. speed, acceleration and transit time and constructed several ranges of each type of property. From our analysis we have found that 60% of CMEs occur in the 500–1500 km s$^{-1}$ category of CME speed. Similarly, 55% of CMEs are distributed over the range of 25–75 hours, of transit time while 60% of CMEs occur in the 0–20 m/s$^2$ category of positive acceleration and 78% of CMEs occur in the 0–20 m/s$^2$ category of negative acceleration. We also investigated the geomagnetic effects of the selected CMEs by considering the geomagnetic storms caused by them. The geomagnetic storms were divided into three categories on the basis of the peak $Dst$ value, as weak ($Dst >- 50$ nT), moderate ($-100$ nT $< Dst \leq -50$ nT) and intense ($Dst \leq -100$ nT). The highest numbers of intense storms were registered in the intermediate ranges of CME properties. Moreover, it was also found that decelerating CMEs produced significantly larger number of intense storms. Hence, decelerating CMEs are more geo-effective than the accelerating CMEs.
A coronal mass ejection (CME) is said to be geo-effective if, on reaching the geospace, it is successful in producing disturbances in the geospace environment i.e. magnetosphere and ionosphere. It is well known that coronal mass ejections and their other interplanetary counterparts are primarily responsible for causing geomagnetic storms [Webb et al., 2001; Zhang et al., 2003].
However, every CME launched from the Sun is not able to cause a geomagnetic storm. It can cause a geomagnetic storm if it is ejected in the direction of the Earth. Only one out of many CMEs is originally pointed in the direction of Earth and hits the Earth [St. Cyr et al., 2000]. The CMEs directed along the Sun–Earth line appear as halos around the occultor disk in the coronagraph field of view, and are called halo CMEs. Hence, only halo CMEs are potential candidates to cause severe geomagnetic disturbances. It has been found that only 50% of all halo CMEs are geo-effective [Gopalswamy et al., 2007; Moon et al., 2005; Wang et al., 2002]. The most important and essential characteristic of a CME (near Earth) that determines its geo-effective character is the way the CME ejecta can cause the interplanetary magnetic field (IMF) to be oriented in southward direction. Therefore, the presence of a southward component ($Bz<0$), of sufficient magnitude and duration ahead and inside of an ICME, is a necessary condition for a CME to cause a geomagnetic storm or be geo-effective [Gosling et al., 1990; Schwenn et al., 2005]. Therefore, geo-effectiveness of an ICME is often characterized by the nature of $Bz$ component of interplanetary magnetic field. However, Burton et al. [1975] showed that the $Dst$ index, a measure of storm time ring current, is an integral value which includes not only $Bz$ but a combination of velocity $V$ and IMF $Bz$ as:
\begin{eqnarray*} Dst \approx dT * Ey \end{eqnarray*}where $dT$ is the duration of $Ey$, where
\begin{eqnarray*} Ey= V \times Bz \end{eqnarray*}In this regard several authors have investigated the correlation of velocity $V$ and IMF $Bz$ with peak $Dst$ index [Gonzalez et al., 2004; Schwenn et al., 2005; Srivastava and Venkatakrishnan, 2004; Yurchyshyn et al., 2004]. All such studies have concluded that the expansion speed of halo CME structures is highly correlated with the peak $Dst$ of the storms they generate. Therefore, the speed of an ICME is a very important characteristic which determines the geo-effectiveness of CMEs.
The change in the speed of CMEs, as they travel through interplanetary space, is also of a great interest. The majority of CMEs are observed in the range of 500–1500 km s$^{-1}$, which indicates that high speed CMEs are decelerating, while slow speed CMEs are accelerating after initiation [Manoharan, 2006; Manoharan and Mujiber Rahman, 2011; Mujiber Rahman et al., 2013].
The change in the speed of CMEs (acceleration/deceleration) is due to the exchange of energy between solar wind and the CME. Therefore, acceleration or deceleration determines how the speed of a CME changes as it travels through interplanetary medium. Therefore, acceleration/deceleration of CMEs has also been considered in earlier studies concerning CMEs geo-effectiveness.
Similarly, Manoharan and Mujiber Rahman [2011] suggested that the transit time of a CME can give some insight into the geo-effective character of a CME. The transit time is the time taken by a CME to reach Earth after being released from the Sun. Therefore, it is an indicator of its average speed between coronagraph field of view and Earth. Usually, a CME takes about 2 days (48 hours) to reach geospace. The transit time is particularly important in geomagnetic storm forecasting.
We have selected 324 halo CMEs events which were observed during 1996–2007, i.e. solar cycle 23, as listed in SOHO LASCO website: http://cdaw.gsfc.nasa.gov. To study the geo-effective properties of halo CMEs as well as their distribution, we considered their three properties viz. speed, acceleration and transit time. The values of speed and acceleration for each selected CME were taken from the SOHO LASCO database. The transit time was computed as the time interval between the start time of CME on the Sun and the commencement of geomagnetic storm.
We identified the geomagnetic storms that were caused by each of the selected CMEs. The selection of the geomagnetic storms, associated with the selected CMEs, was made on the basis of storm intensity index ($Dst$). The identified geomagnetic storms were then classified into three categories, on the basis of peak $Dst$ index and were labeled as intense ($Dst \leq -100$ nT), moderate ($-100$ nT$
|
| Figure 1 |
After we had constructed different intensity ranges for CME properties and geomagnetic storms, we computed the number of events (CMEs and geomagnetic storms) in each range of CME properties. The final datasets and datasheets were prepared for carrying out the analysis and obtaining the results. We first examined the distribution of CMEs over the different ranges of their three important properties i.e speed, acceleration and transit time. The distribution of CMEs over different ranges of CME speed is shown in Figure 1.
From Figure 1, we notice that the highest percentage (37.34%) of CMEs occur in the range of 500–1000 km s$^{-1}$, while 22.53% of CMEs fall in the range of 1000–1500 km s$^{-1}$. Therefore, about 60% of CMEs are distributed in the range of 500–1500 km s$^{-1}$. It can be clearly seen that very high speed CMEs are minor (only 8.32%). Similarly, low speed CMEs are only 17.59%. It can be concluded that a larger number of CMEs occur in the intermediate speed range where as low and high speed CMEs are less in number.
 |
| Figure 2 |
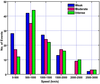
We then examined the distribution of storms of different intensities over different ranges of CME speed. The distribution of weak, moderate and intense storms over the different ranges of CME speed is shown in Figure 2. It can be clearly seen, from Figure 2, that in the low speed range the weak storms dominate while in the high speed range ($<2000$ km s$^{-1}$) intense and moderate storms prevail, the weak storms are either absent or lesser in number. Although, there is no considerable difference between the occurrences of weak, moderate and intense storms in the three intermediate ranges of CME speeds i.e 500–1000, 1000–1500 and 1500–2000 km s$^{-1}$, but intense and moderate ones tend to dominate (excluding 1000–1500 band). Therefore, the higher the speed of CME, the higher will be the intensity of the resulting geomagnetic storm.
 |
| Figure 3 |
The distribution of CMEs over different ranges of CME acceleration (positive and negative) is shown in Figure 3.
In general, we found that out of 324 events, 122 (37.65%) events have a positive acceleration i.e. these are accelerating where as 199 events (61.41%) have a negative acceleration i.e. these are decelerating. It clearly shows that larger number of CMEs is ejected from the Sun with a speed greater than the speed they possess near Earth and lesser number of CMEs is released at slow speeds.
In both types of accelerations, the maximum percentage of CMEs was found to be distributed over 0–10 ms$^{-2}$ category. In positive acceleration category, we find that about 60% of CMEs lie in the range 0–10 ms$^{-2}$ and about 80% of the CMEs accelerate below 20 ms$^{-2}$. Only a significantly lesser number of CMEs have more acceleration. Similarly, in negative acceleration category, we find about 35% of events occur in the range of 0–10 ms$^{-2}$ while about 60% of the events occur below 20 ms$^{-2}$. A significantly lesser number of CMEs decelerate more. Therefore, it can be concluded that most of the CMEs experience acceleration of 0 to $\pm 10$ ms$^{-2}$.
 |
| Figure 4 |
Next we studied the distribution of weak, moderate and intense geomagnetic storms over CME acceleration, and is shown in Figure 4. From Figure 4, we can notice that, in the range of 0 to $\pm 10$ the intense storms occur more often than weak and moderate storms. However, in higher acceleration ranges, particularly in negative acceleration category, the weak storms prevail. Moreover, it can be seen that highest fraction of intense storms is associated with decelerating CMEs. Therefore, decelerating CMEs are more geo-effective.
 |
| Figure 5 |
The third property of the CMEs considered, in this study, is the transit time i.e. time taken by a CME to reach the Earth after being launched from the Sun. The distribution of CMEs with the transit time is shown in Figure 5.
 |
| Figure 6 |
In Figure 5 we notice that about 60% of CMEs have a transit time of 25–75 hours i.e. they take 1–3 days and about 75% of CMEs take less than 100 hours (4 days) to reach Earth. Similarly, about 11.72% of the CMEs are found to be having transit time of 100 to 125 hours. Only about 6% of CMEs have more transit times. Therefore, it can be concluded that the majority of CMEs travel for 50 hours (2 days) to arrive at geospace after leaving the Sun. We also investigated the distribution of different kinds of geomagnetic storms over the transit time, it is shown below in Figure 6.
From Figure 5 we notice that the highest number of intense storms lie in the 25–50 interval. In other intervals ($>25-50$) the number of weak and moderate storms is greater.
Therefore, it can be concluded that CMEs which take about 50 hrs to reach geospace are able to produce geomagnetic storms of greater intensity, hence are more geo-effective.
We found that CMEs are distributed with three important characteristics. Yet the majority of CMEs occur with a particular set of properties. Even if CMEs are released from the Sun with properties in other ranges they interact with solar wind and interplanetary medium and adjust their properties to this range. The more interesting result obtained is that the significantly larger fraction of intense geomagnetic storms is found to be caused by CMEs with this particular range of properties. Hence, such CMEs are more geo-effective than the CMEs with properties in other ranges.
We found that 60% of CMEs are distributed in the range 500–1500 km s$^{-1}$, 8.32% in the very high speed range and 17.59% in low speed range. It is concluded that a significant fraction of CMEs occurs in the intermediate speed range while as low and high speed CMEs are less in number. In low speed range, the occurrences of weak storms are largest while in high speed range the occurrences of intense and moderate storms are more often.
We found that 62% CMEs possess negative acceleration while only 38% have positive acceleration i.e. decelerating CMEs are more frequent.
Under positive acceleration category we found that 60% of CMEs are in the 0–10 ms$^{-2}$ range and about 80% of the CMEs suffer an acceleration of $>20$ ms$^{-2}$. Similarly, under the negative acceleration category, 35% of the CMEs occur in the range of 0–10 ms$^{-2}$ while about 60% of the events occur below 20 ms$^{-2}$. Therefore, it is concluded that CMEs usually experience an acceleration of 0 to $\pm 20$ ms$^{-2}$. The number of intense storms in the acceleration interval $0 \pm 10$ ms$^{-2}$ is larger than the number of weak and moderate storms, while in intervals with higher acceleration, particularly in negative acceleration category, the occurrences of weak storms are usually occur more often. It was also found that the highest fraction of intense storms is created by decelerating CMEs.
We found that about 60% of CMEs have a transit time of 25–75 hours i.e. take 1–3 days and about 75% of CMEs take less than 100 hours (4 days) to reach Earth. The highest number of intense storms lies in the 25–50 interval of transit time. In other intervals ($>25-50$) of transit time, the number of weak and moderate storms is greater.
Burton, R. K., R. L. McPherron, C. T. Russel (1975), An empirical relationship between interplanetary conditions and $Dst$, J. Geophys. Res., 80, p. 4204–4214, https://doi.org/10.1029/JA080i031p04204.
Gonzalez, W. D., A. dal Lago, A. L. Clua de Gonzalez, L. E. A. Vieira, B. T. Tsurutani (2004), Prediction of peak $Dst$ from halo CME/magnetic cloud-speed observations, J. Atmos. Sol.-Terr. Phys., 66, p. 161–165, https://doi.org/10.1016/j.jastp.2003.09.006.
Gopalswamy, N., S. Yashiro, S. Akiyama (2007), Geoeffectiveness of halo coronal mass ejections, J. Geophys. Res., 112, p. A06112, https://doi.org/10.1029/2006JA012149.
Gosling, J. T., S. M. Bame, R. Elphic, C. T. Russell (1990), Plasma Flow Reversals at the Dayside Magnetopause and the Origin of Asymmetric Polar Cap Convection, J. Geophys. Res., 95, no. A6, p. 8073–8084, https://doi.org/10.1029/JA095iA06p08073.
Manoharan, P. K. (2006), Evolution of Coronal Mass Ejections in the Inner Heliosphere: A Study Using White-Light and Scintillation Images, Solar Phys., 235, p. 345, https://doi.org/10.1007/s11207-006-0100-y.
Manoharan, P. K., Rahman Mujiber (2011), Coronal mass ejections propagation time and associated internal energy, J. Atmos. Sol. Terr. Phys., 73, p. 671–677, https://doi.org/10.1016/j.jastp.2011.01.017.
Moon, Y. J., K. S. Cho, M. Dryer, Y. H. Kim, S. C. Bong, J. Chae, Y. D. Park (2005), New Geo-effective parameters of very fast Halo Coronal Mass Ejections, Astrophys. J., 624, p. 414, https://doi.org/10.1086/428880.
Mujiber Rahman, A., A. Shanmugaraju, S. Umapathy (2013), Propagation of normal and faster CMEs in interplanetary medium, Adv. Space Res., 52, p. 1168–1177, https://doi.org/10.1016/j.asr.2013.05.033.
Schwenn, R., et al. (2005), The association of coronal mass ejections with their effects near the Earth, Ann. Geophys., 23, p. 1033–1059, https://doi.org/10.5194/angeo-23-1033-2005.
Srivastava, N., P. Venkatakrishnan (2004), Solar and interplanetary sources of major geomagnetic storms during 1996–2002, J. Geophys. Res., 109, p. A10103, https://doi.org/10.1029/2003JA010175.
St. Cyr, O. C., et al. (2000), Properties of coronal mass ejections: SOHO LASCO observations from January 1996 to June 1998, J. Geophys. Res., 105, no. A8, p. 18,169–18,186, https://doi.org/10.1029/1999JA000381.
Wang, Y. M., P. Z. Ye, S. Wang, G. P. Zhau, J. Wang (2002), A statistical study on the geoeffectiveness of Earth-directed coronal mass ejections from March 1997 to December 2000, J. Geophys. Res., 107, p. 1340, https://doi.org/10.1029/2002JA009244.
Webb, D. F., et al. (2001), The solar sources of geoeffective structures, Space Weather, edited by Paul, S., Howard, J. S. and George, L.S., Geophys. Monogr. Ser., 125, p. 123–142, AGU, Washington, D.C.
Yurchyshyn, V., H. Wang, V. Abramenko (2004), Correlation between speeds of coronal mass ejections and the intensity of geomagnetic storms, Space Weath., 2, p. S02001, https://doi.org/10.1029/2003SW000020.
Zhang, J., K. P. Dere, R. A. Hovard, V. Bothmer (2003), Identification of solar sources of major geomagnetic storms between 1996 and 2000, Astrophys. J., 582, p. 520–533.
Received 31 October 2017; accepted 12 March 2018; published 29 May 2018.

Citation: Bhardwaj Shivangi, Parvaiz A. Khan, Roshni Atulkar, P. K. Purohit (2018), Investigation of geo-effective properties of halo coronal mass ejections, Russ. J. Earth Sci., 18, ES1003, doi:10.2205/2018ES000620.
Copyright 2018 by the Geophysical Center RAS.