RUSSIAN JOURNAL OF EARTH SCIENCES, VOL. 17, ES3002, doi:10.2205/2017ES000598, 2017
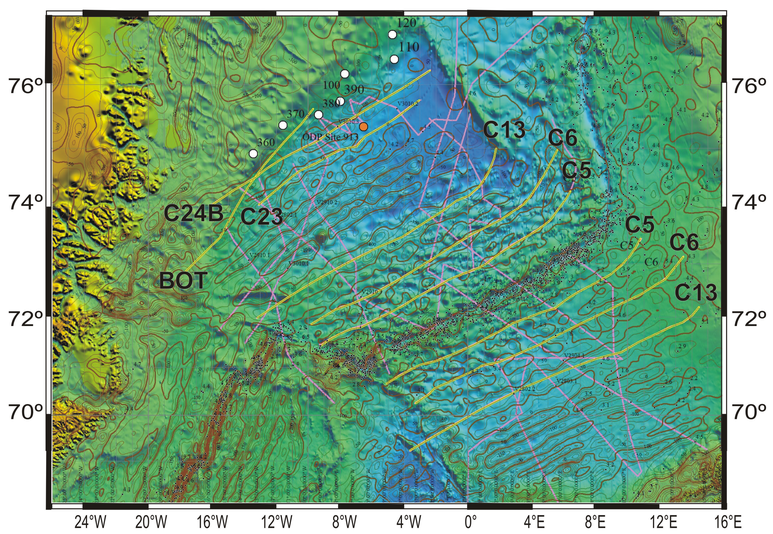
Figure 22. A map of magnetic anomalies in the Norwegian–Greenland region. The magnetic isolines are in nT; yellow lines with index C5-24B are axes of magnetic anomalies [EMAG-2: Earth Magnetic Anomaly Grid; http://www.geomag.us/models/emag2.html]; BOT denotes the line that marks the ocean-continent transition boundary [Voss and Jokat, 2007]; open circles are basement highs; the numeral is the identification number of the CDP line where these were identified (see Figure 1) [Berger and Jokat, 2008]. The red circle marks the ODP site 913.

![]()
Citation: Usenko S. V., A. N. Boyko, T. V. Prokhorova (2017), Seafloor relief inhomogeneities and the tectonics of the Greenland-Lofoten Basin in the North Atlantic, Russ. J. Earth Sci., 17, ES3002, doi:10.2205/2017ES000598.
Copyright 2017 by the Geophysical Center RAS.
Generated from LaTeX source by ELXpaper, v.1.5 software package.