RUSSIAN JOURNAL OF EARTH SCIENCES, VOL. 17, ES3002, doi:10.2205/2017ES000598, 2017
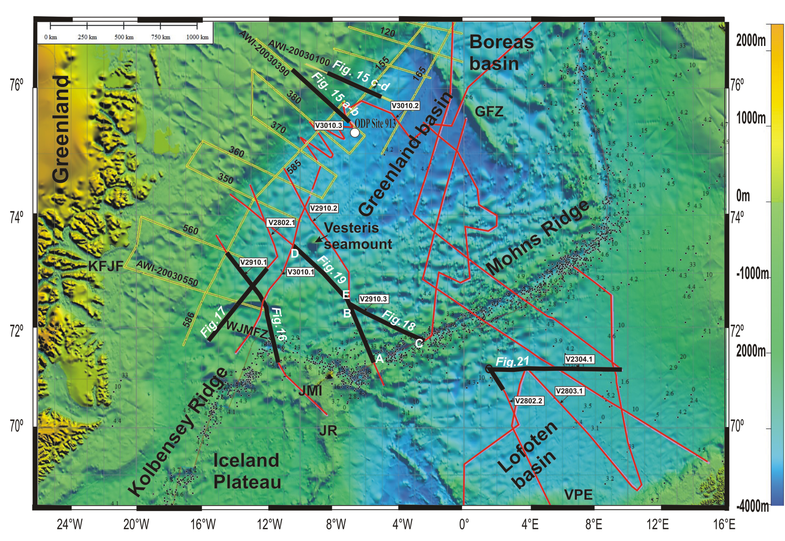
Figure 1. A map of the study area with the SRTM-30.4 bathymetric base [Becker et al., 2009]. The yellow lines are parts of the multichannel seismic (MCS) network from [Berger and Jokat, 2008]; the pink lines show the single seismic cruise of the RS Vema; the open circle marks the ODP drill site 913; GFZ is short for Greenland Fracture Zone; KFJF stands for Keiser Franz Joseph Fjord, WJMFZ for West Jan-Majen Fracture Zone, JR for the Jan Mayen Ridge, and JMI for Jan Mayen Island; small red dots are earthquake epicenters with magnitudes attached (www.globalcmt.org); Figure 15–Figure 21 shows the positions of the seismic lines discussed in main text.

![]()
Citation: Usenko S. V., A. N. Boyko, T. V. Prokhorova (2017), Seafloor relief inhomogeneities and the tectonics of the Greenland-Lofoten Basin in the North Atlantic, Russ. J. Earth Sci., 17, ES3002, doi:10.2205/2017ES000598.
Copyright 2017 by the Geophysical Center RAS.
Generated from LaTeX source by ELXpaper, v.1.5 software package.