RUSSIAN JOURNAL OF EARTH SCIENCES, VOL. 20, ES3005, doi:10.2205/2020ES000700, 2020
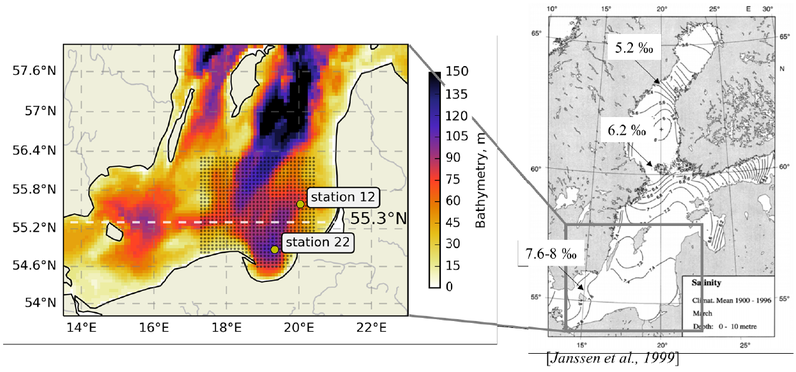
Figure 2. Left – Baltic Proper bathymetry in colour. A white dashed line indicates a cross section towards 55.3° N, yellow dots – position of the used stations from the cruses. Black dots – initial position of drifters for back-tracking. Right – Monthly mean surface (0–10 m) salinity in March (from the Climatological data set [Janssen et al., 1999]).

![]()
Citation: Stepanova N., A. Mizyuk (2020), Tracking the formation of the gradient part of the southeastern Baltic Sea cold intermediate layer, Russ. J. Earth Sci., 20, ES3005, doi:10.2205/2020ES000700.
Copyright 2020 by the Geophysical Center RAS.
Generated from LaTeX source by ELXfinal, v.2.0 software package.