
RUSSIAN JOURNAL OF EARTH SCIENCES, VOL. 20, ES2004, doi:10.2205/2020ES000686, 2020
Le Hung Trinh1, Thi Giang Le2, Van Hoan Kieu3, Thi Minh Ly Tran3, Thi Thu Nga Nguyen1
1Le Quy Don Technical University, Hanoi, Vietnam
2Vietnam National University of Agriculture, Hanoi, Vietnam
3Hanoi National University of Education, Hanoi, Vietnam
In the recent years, the Ninh Binh and Nam Dinh shoreline had a strong fluctuation due to the impact of natural conditions and economic activity of people. Therefore, the monitoring of shoreline changes is very important for coastal manage in the context of climate change today. In this study, a total of 5 scenes of Landsat 5 TM and 01 scene of Landsat 8 OLI/TIRS satellite images from 1988 to 2018 were used to extract shoreline based on water indices, such as Automated Extraction Water Index (AWEI$_\mathrm{sh}$, AWEI$_\mathrm{nsh}$), Normalized Difference Water Index (NDWI) and Modified Normalized Difference Water Index (MNDWI). Assessing the accuracy of automatically extracted shorelines on Ninh Binh and Nam Dinh coastal from Landsat data show that, the accuracy of shoreline extraction using AWEI$_\mathrm{sh}$ index is higher than using other water indices, which is reflected in the comparison of mean square error (MSE) and Kappa values. The results show that the coastline of Nam Dinh area tends to erode in the period 1988–2018, in which the most eroded length amounted to 987 m. Meanwhile, the coastal area of Ninh Binh province is strongly accreted, with the lengths of accretion amounted to several kilometers in period 1988–2018. The results obtained in the study provide timely informations to help managers on monitoring and protecting coastlines and coastal ecosystems.
Vietnam is a country with a long coastline, with many large estuaries, which is a suitable environment for the development of the mangrove forest ecosystem. The coastal zone of Vietnam is 3260 km long, extending through the territories of 24 provinces and cities, which include 127 urban and rural districts, 21 towns and 6 cities [Cat et al., 2006; Cuong and Cu, 2014]. Here occur a series of interactive processes between the natural and human processes. The coastal zone of Vietnam also receives many natural calamities, causing multidirectional impacts on the nature and socio-economic conditions [Cat et al., 2006]. In recent decades, coastal erosion and accretion in the coastal zone of Vietnam has been occurring in a rather complicate manner, in many areas, causing serious consequences. The intensity and extent of the erosion occurring in each province are also different. The application of modern technologies, including remote sensing allows to reduce expenses and save time in shoreline changes detection.
Extracting surface water distribution with satellite imagery has been an important subject in remote sensing [Ji et al., 2015]. Various methods have been applied to detect and map water body, especially due to the availability of a large range of satellite sensors Masocha et al. [2018]. The reflective bands of multispectral image, defined as those with wavelengths from the visible to the mid-infrared, have been used for mapping water body from the very early days of remote sensing [Guerschman et al., 2011]. In general detecting water relies on the fact that water strongly absorbs incoming radiation in the near to mid-infrared wavelengths [Guerschman et al., 2011; Huang et al., 2018].
Many studies in the world have used optical satellite image data for river bank and coastline extraction based on methods such as visual interpretation method, method based on water indices, unsupervised and supervised classification methods. Although digitalization method is based on visual interpretation using red, near infrared and shortwave infrared spectral bands of satellite imagery is highly accurate, it takes a lot of time and effort, therefore, it is difficult to apply to large-scale studies [Yang et al., 2015]. Based on the analysis of the spectral characteristic of the water body, Winasro and Budhiman [2001] used three bands of Landsat 5 TM image, including band 2 (green), band 4 (near-infrared) and band 5 (shorware infrared) to calculate the band ratio images (bands 4/2, 5/2) and extract shorline. Alesheikh et al. [2007] developed Winasro and Budhiman's method, in which the authors also used green, red and near-infrared bands of Landsat satellite images and adding threshold method to the shortwave infrared band (band 5 of Landsat TM image).
On the basis of analyzing the spectral reflectance characteristics of visible and infrared spectral bands acquired by the Landsat satellite, many water indices have been proposed such as Normalized Difference Water Index (NDWI) [Gao, 1996; Liu et al., 2017; McFeeters, 1996; Xiao et al., 2002], Modified Normalized Difference Water Index (MNDWI) [Xu, 2006], Water Ratio Index (WRI) [Shen and Li, 2010]. However, the selection of threshold values for detection of shoreline from these water indices images is a difficult problem because this value varies with time and space [Feyisa et al., 2014].
From analyzing the limitations of existing water indices, Feyisa et al. [2014] proposed the use of Automatic Water Extraction Index (AWEI) to provide a stable threshold value, thereby improving the accuracy of shoreline extraction from remote sensing water indices. The index includes two indices: AWEI$_\mathrm{nsh}$ and AWEI$_\mathrm{sh}$. They are a linear combination of the blue (band 1), green (band 2), NIR (band 4), SWIR 1 (band 5), and SWIR 2 (band 6) bands of Landsat TM data. AWEI$_\mathrm{nsh}$ is mainly used in areas with an urban background, while AWEIsh is primarily designed to remove shadow pixels [Ji and Gong, 2017]. The AWEI index is also used in a number of studies and proves its effectiveness when compared to other water indices [Acharya et al., 2018a, 2018b; Colak et al., 2018; Ji et al., 2015; Mustafa et al., 2017; Masocha et al., 2018].
Jiang et al. [2014] were developed An Automated Method for Extracting Rivers and Lakes (AMERL) by combining NDWI, MNDWI, AWEI$_\mathrm{sh}$ and AWEI$_\mathrm{nsh}$ water indices to identify water pixels, especially mixed water pixels in shallow or narrow water bodies [Jiang et al., 2014].
In Vietnam, most of the studies in shoreline extraction from remote sensing data are mainly focused on the use of water indices (NDWI, MNDWI) or band ratio images [Nguyen et al., 2019; Trung and Khanh, 2016; Tran et al., 2016]. Almost no research has evaluated the accuracy of using water indices to extract the shoreline, and then from that selected the suitable index for the testing area.
This paper focuses on the application of Landsat multi-temporal data to assess and evaluate shoreline change in Ninh Binh and Nam Dinh provinces (North of Vietnam) during period 1988–2018. In this study, the water indices, including NDWI, MNDWI, AWEI$_\mathrm{sh}$ and AWEI$_\mathrm{nsh}$ were used to extract the shoreline from Landsat multispectral image. The suitable index for the testing area is selected based on the comparison of water and non-water classification accuracy, then vectorized to map shoreline changes.
|
| Figure 1 |
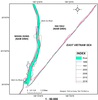
Ninh Binh and Nam Dinh are provinces of Vietnam, in the Red River Delta region of the northern part of the country (Figure 1). The both provinces covers an area of 3046.1 km$^2$ and had a population over of 3 million people.
Lying in the south of Red River Delta, Nam Dinh is situated between $19\mbox{°} 54'$ to $20\mbox{°} 40'$ north latitude, $105\mbox{°} 55'$ to $106\mbox{°} 45'$ east longtitude. The province has 72 km long coastline from Ba Lat estuary to Day estuary. The shoreline change in Nam Dinh province in Vietnam is a chronic problem [To and Thao, 2008; Thinh and Hens, 2017]. The 87-year historical data from 1905–1992 show that there is beach erosion in Hai Hau district (the shoreline retreats 25–29 m/year) and a beach accretion in Nghia Hung and Xuan Thuy districts (the shoreline advances 12–23 m/year in Nghia Hung and 37–39 m/year in Xuan Thuy disticts, correspondingly) [To and Thao, 2008].
Ninh Binh province is bounded between latitude $19\mbox{°} 50'$ N to $20\mbox{°} 27'$ N and longitude $105\mbox{°} 32'$ E to $106\mbox{°} 27'$ E. It has a coastline of 15 km with the trend of accretion. Annual, the coastline of Ninh Binh is covered by silt over 100 m. Ninh Binh coastal area is located in the Biosphere Reserve of the Red River Delta, which was recognised as a world biosphere reserve in 2004 by UNESCO for its rich biodiversity (http://unesco.org).
 |
| Figure 2 |
Figure 2 presents some pictures in the survey in the study area, icluding: Kim Son alluvial ground, Ninh Binh province (Figure 2a), Day river mouth (Figure 2b), road in Kim Son alluvial ground (Figure 2c) and erosion in Hai Hau district, Nam Dinh province (Figure 2d). This field survey was conducted on 2 December 2018 to understand the shoreline change process in study area.
 |
| Figure 3 |
 |
| Table 1 |
In this study, six multispectral cloud – free Landsat 5 TM and Landsat 8 OLI/TIRS images (path 126, row 46) with a spatial resolution of $30 \times 30$ meters were acquired from 1988, 1991, 2000, 2006, 2010 and 2018 (Figure 3 and Table 1.) The Landsat data was the standard terrain correction products (L1T), downloaded from United States Geological Survey (USGS – http://glovis.usgs.gov) website. These satellite images were taken during the dry season, in the October and November. Arcoding the tide times and tide charts in Nam Dinh and Ninh Binh provinces, the tide is usually less than 1.0 m at 10:30 am (http://tidechart.com). This is also the time when Landsat satellites acquires data in study area. Thus, the tide does not significantly affect for extraction of the coastline from Landsat data in study area.
Image processing started with radiometric and geometric correction. In first step, the brightness of the pixel value (digital number) is converted into the spectral radiance value (W m$^{-2} \mu$m$^{-1}$).
2.3.1. Landsat 5 TM. Based on NASA model, the digital values of spectral bands Landsat 5 TM were converted to spectral radiance using following equation (1) (http://landsat.gsfc.nasa.gov, assessed 3 June 2019):
\begin{equation} \tag*{(1)} L_\lambda = G_{\mathrm{rescale}} DN + B_{\mathrm{rescale}} \end{equation}where: $L_\lambda$ – spectral radiance at the sensor's aperture; $ DN$ – the quantized calibrated pixel value in digital number;
$G_{\mathrm{rescale}}$ – band specific rescaling gain factor ((W/m$^2$ sr $\mu$ m)/$DN$); $B_{\mathrm{rescale}}$ – band specific rescaling bias factor (W/m$^2$ sr $\mu$ m).
In the second step, the TOA reflectance is computed according to the equation (2) (http://landsat.gsfc.nasa.gov, assessed 3 June 2019):
\begin{equation} \tag*{(2)} \rho_\lambda = \frac{\pi L_\lambda d^2} {\mathrm{ESUN}_\lambda \cos (\theta_{\mathrm{SZ}})} \end{equation}where: $\rho_\lambda$ – planetary TOA reflectance; $\pi$ – mathematical constant approximately equal to 3.14159; $L_\lambda $ – spectral radiance at the sensor's aperture; $ D$ – Earth–Sun distance (astronomical units); ESUN – Mean exoatmospheric solar irradiance (W/m$^2$ sr $\mu$ m); $\theta_{\mathrm{SZ}}$ – Local solar zenith angle (degree).
2.3.2. Landsat 8 OLI/TIRS. Landsat 8 OLI/TIRS band data can also be converted to TOA planetary reflectance using reflectance rescaling coefficients provided in the product metadata file. The following equation (3) is used to convert digital number values to TOA reflectance for Landsat 8 OLI/TIRS data as follows (http://landsat.gsfc.na sa.gov, assessed 3 June 2019):
\begin{equation} \tag*{(3)} \rho_\lambda = M_p Q_{\mathrm{cal}} + A_p \end{equation}where: $\rho_\lambda$ – TOA planetary reflectance, without correction for solar angle; $M_p$ – Band-specific multiplicative rescaling factor from the metadata, (REFLECTANCE_MULT_BAND_$x$, where $x$ is the band number); $A_p$ – Band-specific additive rescaling factor from the metadata (REFLECTANCE_ADD_BAND_$x$, where $x$ is the band number); $Q_{\mathrm{cal}}$ – Quantized and calibrated standard product pixel values (DN).
TOA reflectance with a correction for the sun angle is then (equation (4))
(http://landsat.gsfc.nasa.gov, assessed 3 June 2019):
\begin{equation} \tag*{(4)} \rho_\lambda = \frac{\rho_\lambda'}{\cos (\theta_{\mathrm{SZ}})}= \frac{\rho_\lambda'}{\sin (\theta_{\mathrm{SE}})} \end{equation}where:
$\rho_\lambda$ – TOA planetary reflectance;
$\theta_{\mathrm{SE}}$ – Local sun elevation angle. The scene center sun elevation angle in degrees is provided in the metadata (SUN_ELEVATION).
In the next step, the surface reflectance value can be calculated using "dark object subtraction" (DOS) atmospheric correction method [Chavez, 1988, 1996]. This method estimates the atmospheric contributions to a surface spectrum by measuring homogeneous surfaces over a range of illumination conditions. The surface reflectance values obtained after this step will be used to calculate the water index.
According to Feyisa et al. [2014], five spectral bands of Landsat data were used to calculate the AWEI index for improving the classification accuracy in areas that include shadow and dark surfaces. The index includes two indices: AWEI$_\mathrm{nsh}$ and AWEI$_\mathrm{sh}$, which calculated following equations:
\begin{eqnarray*} \mathrm{AWEI}_\mathrm{sh} = \rho_{\mathrm{blue}} + 2.5 \rho_{\mathrm{green}} - \end{eqnarray*} \begin{equation} \tag*{(5)} 1.5 (\rho_{\mathrm{NIR}} + \rho_{\mathrm{SWIR1}}) - 0.25 \rho_{\mathrm{SWIR2}} \end{equation} \begin{eqnarray*} \mathrm{AWEI}_\mathrm{nsh} = 4 (\rho_{\mathrm{blue}} - \rho_{\mathrm{SWIR1}}) - \end{eqnarray*} \begin{equation} \tag*{(6)} 0.25 \rho_{\mathrm{NIR}} + 2.75 \rho_{\mathrm{SWIR2}} \end{equation}where: $\rho_{\mathrm{blue}}$, $\rho_{\mathrm{green}}$, $\rho_{\mathrm{red}}$, $\rho_{\mathrm{SWIR1}}$ are reflectance values of blue, green, red, near infrared (NIR) and short wave infrared (SWIR1 and SWIR2) bands of Landsat multispectral image.
In addition, the study also used other water indices, such as NDWI [Gao, 1996], MNDWI [Xu, 2006] to compare and evaluate shoreline extraction based on AWEI index. These indices can be calculated following the equations:
\begin{equation} \tag*{(7)} \mathrm{MNDWI} = \frac{ \rho_{\mathrm{GREEN}} - \rho_{\mathrm{SWIR1}}} { \rho_{\mathrm{GREEN}} + \rho_{\mathrm{SWIR1}}} \end{equation} \begin{equation} \tag*{(8)} \mathrm{NDWI} = \frac{ \rho_{\mathrm{NIR}} - \rho_{\mathrm{SWIR1}}} { \rho_{\mathrm{NIR}} + \rho_{\mathrm{SWIR1}}} \end{equation}where: $\rho_{\mathrm{GREEN}}$, $\rho_{\mathrm{RED}}$, $\rho_{\mathrm{NIR}}$, $\rho_{\mathrm{SWIR1}}$ are reflectance values of green, red, near infrared (NIR) and short wave infrared (SWIR1) bands of Landsat multispectral image.
 |
| Figure 4 |
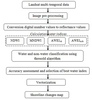
In this study, image processing is done by using ERDAS Imagine 2014 and ENVI 5.2 programs, and shoreline change maps were created using ArcGIS 10 program. Flowchart for the methodology used in this study to extract shoreline changes based on Landsat multi-temporal data is shown in Figure 4.
The Landsat multi-temporal data after pre-processing, the reflectance values for blue, green, red, NIR, SWIR1 and SWIR2 bands were used to calculate AWEI$_\mathrm{sh}$ (5) and AWEI$_\mathrm{nsh}$ indices (6). In addition, NDWI and MNDWI indices are also calculated from Landsat satellite images for shoreline extraction ((7) and (8)).
 |
| Figure 5 |
 |
| Figure 6 |
 |
| Figure 7 |
 |
| Figure 8 |
In this study, the Otsu automated threshold method was used to classify water and non-water from AWEI$_\mathrm{sh}$, AWEI$_\mathrm{nsh}$, NDWI and MNDWI incides. A histogram shape-based Otsu method that is based on discriminate analysis. It uses the zero- and first-order cumulative moments of the histogram for calculating the value of the thresholding level. This image processing is done by using ENVI 5.2 program.
 |
| Table 2 |
The mean square error (MSE) values and Kappa index were used o compare the classificatuon accuracy from AWEI$_\mathrm{sh}$, AWEI$_\mathrm{nsh}$, NDWI and MNDWI incides. At the test sites in Ninh Binh and Nam Dinh coastal area, where dark shadows were abundant, visual inspection clearly shows that AWEI$_\mathrm{sh}$ suppressed shadowed surfaces more effectively than AWEI$_\mathrm{nsh}$, NDWI and MNDWI indices. The MSE value is the smallest and Kappa index is the highest when classofying water and non-water using AWEIsh index (Table 2.)
 |
| Figure 9 |
In the next step, the threshold algoritm is used to classify water and non-water using AWEIsh index. Then, the classification results are vectorized and used to map shoreline changes. The shoreline changes map of Ninh Binh and Nam Dinh provinces in the period of 1988–2018, which built from Landsat satellite image based on the AWEIsh index shows in Figure 9.
Analysis of the obtained results showed that the shoreline changes in Ninh Binh–Nam Dinh coastal area were divided into two distinct trends: accretion in the coastal areas of Ninh Binh province and a part of Nam Dinh province; erosion in the coastal area of Nam Dinh province (from Ninh Co river mouth to the north of Nam Dinh coastal area).
 |
| Figure 10 |
At the coastal area of Hai Hau district (Nam Dinh province, northeast of study area), coastline erosion is stable during the period 1988–2018, with the highest erosion rate is nearly 10 m/year (Figure 10). In general, the coastline erosion in this area is not strong with low annual erosion rate.
Meanwhile, the accretion activity is very powerful, especially on the two sides of Day river mouth, with a accretion rate of up to hundreds of meters per year. The shoreline changes in study area can be divided into 2 periods: the period from 1988 to 2000 years and the period from 2000 to 2018 years.
At the coastal area on both sides of the Day river basin, the natural border of Kim Son district (Ninh Binh province) and Nghia Hung district (Nam Dinh province), only within 12 years, the accretion of coastline has been strongly and continuously in the period from 1988 to 2000 years. The most accreted area is between the Kim Son and the Nghia Hung districts with accretion rate was nearly 143 m/year in Kim Son district and 314 m/year in Nghia Hung district. The acrretion rate in the period 1988–2000 is much higher than the average annual accretion rate in the period 1988–2018 (85 m/year in Kim Son coastal area and 261 m/years in Nghia Hung coastal area).
 |
| Figure 11 |
The shoreline changes map of Ninh Binh and Nam Dinh provinces in the period of 1988–2000 shows in Figure 11.
 |
| Figure 12 |
At this stage, the accretion rate in the coastal area of Kim Son district (Ninh Binh province) decreased to 44 m/year. Similarly, the accretion rate in the coastline of Nghia Hung district (Nam Dinh province) in the period 2000–2018 also decreased significantly compared to the period 1988–2000, about 120 m/year (Figure 12).
In general, the accretion coastline rate tends to decrease from the south to the north of study area and to the mouth of the Ninh Co river (Nam Dinh province), the trend of coastline erosion is beginning to appear, with the highest erosion rate of about 70 m/year.
In this study, we used Landsat time series data in period 1988–2018 to monitor and assess shoreline changes in Ninh Binh and Nam Dinh provinces (the northern part of Vietnam). Water indices, including NDWI, MNDWI, AWEI$_\mathrm{nsh}$, AWEI$_\mathrm{sh}$ are used to classify water and non-water, then select suitable index to vectorize and extract the shoreline of the study area. In this study, the AWEIsh index was selected to extract the shoreline on the basis of comparing water and non-water classification accuracy with other indices.
The obtained results show that, the shoreline of Ninh Binh and a part of Nam Dinh provinces (Nghia Hung district) has a general tendency to accretion, in which many areas are accreted with annual accretion rate of up to hundreds of meters. The accretion rate in the period 1988–2000 is also much higher than in the period 2000–2018. Meanwhile, the coastline of Nam Dinh province from the Ninh Co estuary to the north has the main trend of erosion, with the highest erosion rate is 70 m/year (the area of Ninh Co river mouth) and 10 m/year (the coastal area of Hai Hau district, Nam Dinh province).
The results obtained in the study are an important and timely source of information to help managers in monitoring, evaluation of shoreline changes as well as the sustainable protection of the ecological environment in the estuarine and coastal areas of Ninh Binh and Nam Dinh provinces.
Acharya, T., A. Subedi, D. Lee (2018a) , Evaluation of water indices for surface water extraction in a Landsat 8 scence of Nepan, Sensors, 18, no. 8, p. 2580, https://doi.org/10.3390/s18082580.
Acharya, T., A. Subedi, I. Yang, D. Lee (2018b) , Combining water indices for water and background threshold in Landsat image, Proceedings, 2, no. 3, p. 143, https://doi.org/10.3390/ecsa-4-04902.
Alesheikh, A., A. Ghorbanali, A. Nouri (2007) , Coastline change detection using remote sensing, International Journal of Environmental Science and Technology, 4, no. 1, p. 61–66, https://doi.org/10.1007/BF03325962.
Cat, N. N., P. H. Tien, D. D. Sam, et al. (2006) , Field study presentation: Status of coastal erosion of Vietnam and proposed measures for protection, Regional Technical Workshop, Khao Lak, Thailand, 28–31 August 2006, p. 131, FAO, Bangkok, Thailand.
Chavez, P. S. (1996) , Image-based atmospheric corrections–revisited and improved, Photogrammetric Engineering and Remote Sensing, 62, no. 9, p. 1025–1036.
Chavez, P. S. (1988) , An improved dark-object subtraction technique for atmospheric scattering correction of multispectral data, Remote Sensing of Environment, 24, p. 459–479, https://doi.org/10.1016/0034-4257(88)90019-3.
Colak, T., G. Senel, C. Goksel (2018) , Coastline zone extraction using Landsat 8 OLI imagery, case study: Bodrum Peninsula, Turkey, The International Archives of the Photogrammetry, Remote Sensing and Spatial Information Sciences, XLII-4/W12, p. 101–104, https://doi.org/10.5194/isprs-archives-XLII-4-W12-101-2019.
Cuong, N. Q., N. V. Cu (2014) , Intergradted coastal management in Vietnam: current situation and orientation, Journal of Marine Science and Technology, 1491, p. 89–96.
Feyisa, G., H. Meiby, R. Fensholt, et al. (2014) , Automated water extraction index: A new technique for surface water mapping using Landsat imagery, Remote Sensing of Environment, 140, p. 23–35, https://doi.org/10.1016/j.rse.2013.08.029.
Gao, B. C. (1996) , NDWI – A normalized difference water index for remote sensing of vegetation liquid water from space, Remote Sensing of Environment, 58, p. 257–266, https://doi.org/10.1016/S0034-4257(96)00067-3.
Guerschman, J. P., G. Warren, et al. (2011) , MODIS-based standing water detection for flood and large reservoir mapping: algorithm development and applications for the Australian continent, CSIRO: Water for a Healthy Country National Research Flagship Report, p. 100, CSIRO, Canberra, Australia.
Huang, C., Y. Chen, S. Zhang, J. Wu (2018) , Detecting, Extracting, and Monitoring Surface Water From Space Using Optical Sensors: A Review, Reviews of Geophysics, 56, no. 2, p. 333–360, https://doi.org/10.1029/2018RG000598.
Ji, L., X. Geng, K. Sun, Y. Zhao, P. Gong (2015) , Target detection method for water mapping using Landsat 8 OLI/TIRS imagery, Water, 7, no. 2, p. 794–817, https://doi.org/10.3390/w7020794.
Ji, L., P. Gong (2017) , Surface water, Comprehensive Remote Sensing (Editor in Chief Liang S.), p. 258–294, Elsevier Science Publishing, ???, https://doi.org/10.1016/B978-0-12-409548-9.10360-4 (ISBN-13:9780128032213).
Jiang, H., M. Feng, Y. Zhu, et al. (2014) , An automated method for extracting rivers and lakes from Landsat imagery, Remote Sensing, 6, no. 6, p. 5067–5089, https://doi.org/10.3390/rs6065067.
Liu, Y., X. Wang, F. Ling, et al. (2017) , Analysis of coastline extraction from Landsat-8 OLI imagery, Water, 9, no. 816, p. 26, https://doi.org/10.3390/w9110816.
Masocha, M., T. Dube, M. Makore, et al. (2018) , Surface water bodies mapping in the Zimbabwe using Landsat 8 OLI multispectral imagery: A comparison of the multiple water indices, Physics and Chemistry of the Earth, 106, p. 63–67, https://doi.org/10.1016/j.pce.2018.05.005.
McFeeters, S. K. (1996) , The use of the Normalized Difference Water Index (NDWI) in the delineation of open water features, International Journal of Remote Sensing, 17, no. 7, p. 1425–1432, https://doi.org/10.1080/01431169608948714.
Mustafa, M., K. Hassoon, H. Hussain, et al. (2017) , Using water indices (NDWI, MNDWI, WRI and AWEI) to detect physical and chemical parameters by apply remote sensing and GIS techniques, International Journal of Research – Granthalayah, 5, no. 10, p. 117–128.
Nguyen, U. N. T., L. T. H. Pham, T. D. Dang (2019) , An automatic water detection approach using Landsat 8 OLI and Google Earth Engine cloud computing to map lakes and reservoirs in New Zealand, Environmental Monitoring and Assessment, 191, no. 4, p. 235, https://doi.org/10.1007/s10661-019-7355-x.
Shen, L., C. Li (2010) , Water Body Extraction from Landsat ETM+ imagery using adaboost algorithm, Proceedings of the 18th International Conference on Geoinformatics, Beijing, China, 18–20 June 2010, p. 1–4, IEEE, Piscataway, NJ, https://doi.org/10.1109/GEOINFORMATICS.2010.5567762.
Thinh, N. A., L. Hens (2017) , A digital shoreline analysis system (DSAS) applied on mangrove shoreling changes along the Giao Thuy coastal area (Nam Dinh, Vietnam) during 2005–2014, Vietnam Journal of Earth Sciences, 39, no. 1, p. 87–96, https://doi.org/10.15625/0866-7187/39/1/9231.
To, D. V., P. T. P. Thao (2008) , A shoreline analysis using DSAS in Nam Dinh coastal area, International Journal of Geoinformatics, 4, no. 1, p. 37–42.
Tran, A. T., D. N. Le, L. P. Vu, et al. (2016) , Shoreline change detection in the Southwest region of Vietnam from 1999 to 2016 using GIS and remote sensing data, Proceedings of the ESASGD 2016, p. 137–144, Transport Publishing House, Hanoi.
Trung, N. V., N. V. Khanh (2016) , Monitoring coastline changes using Landsat multi-temporal data in the Cua Dai estuary, Thu Bon river, Quang Nam, Journal of Mining and Earth Sciences, 57, p. 81–89.
Xiao, X., S. Boles, S. Frolking, et al. (2002) , Observation of flooding and rice transplanting of paddy rice fields at the site to landscape scales in China using VEGETATION sensor data, International Journal of Remote Sensing, 23, no. 15, p. 3009–3022, https://doi.org/10.1080/01431160110107734.
Xu, H. (2006) , Modification of normalised difference water index (NDWI) to enhance open water features in remotely sensed imagery, International Journal of Remote Sensing, 27, no. 14, p. 3025–3033, https://doi.org/10.1080/01431160600589179.
Winasro, G., S. Budhiman (2001) , The potential application of remote sensing data for coastal study, Proc. 22nd Asian Conference on Remote sensing, p. 5, National University of Singapore, Singapore.
Yang, Y., Y. Liu, M. Zhou, et al. (2015) , Landsat 8 OLI image based terrestrial water extraction from heterogeneous backgrounds using a reflectance homogenization approach, Remote Sensing of Environment, 171, p. 14–32, https://doi.org/10.1016/j.rse.2015.10.005.
Received 29 July 2019; accepted 17 October 2019; published 28 March 2020.

Citation: Trinh Le Hung, Thi Giang Le, Van Hoan Kieu, Thi Minh Ly Tran, Thi Thu Nga Nguyen (2020), Application of remote sensing technique for shoreline change detection in Ninh Binh and Nam Dinh provinces (Vietnam) during the period 1988 to 2018 based on water indices, Russ. J. Earth Sci., 20, ES2004, doi:10.2205/2020ES000686.
Copyright 2020 by the Geophysical Center RAS.