RUSSIAN JOURNAL OF EARTH SCIENCES, VOL. 21, ES4003, doi:10.2205/2021ES000767, 2021
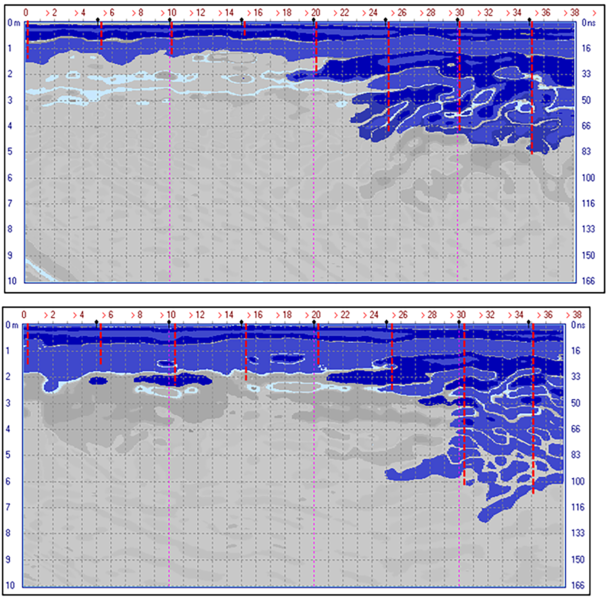
Figure 4. Examples of LOZA GPR profiles made on ice formation numbered 7. Horizontal axis numbers are distances in m. Left vertical axis numbers demote thickness in m. Above is profile E, below is profile F. Ice is shown in blue. Water under the ice or between layers of ice is shown in gray. Red vertical lines are positions and results of auger mechanical drilling using a 5 cm diameter drill.

![]()
Citation: Morozov P. A., A. I. Berkut, P. L. Vorovsky, F. P. Morozov, S. V. Pisarev (2021), Measuring sea ice thickness with the LOZA georadar, Russ. J. Earth Sci., 21, ES4003, doi:10.2205/2021ES000767.
Copyright 2021 by the Geophysical Center RAS.
Generated from LaTeX source by ELXfinal, v.2.0 software package.