RUSSIAN JOURNAL OF EARTH SCIENCES, VOL. 21, ES1006, doi:10.2205/2020ES000747, 2021

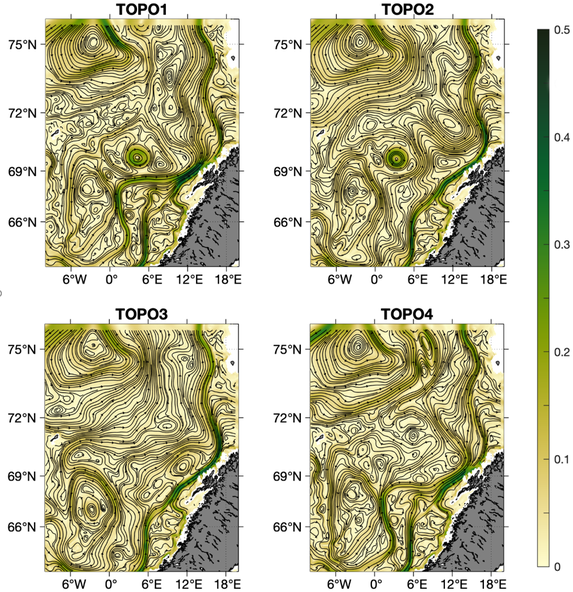
Figure 3. Time-mean spatial distribution of velocities, m s$^{-1}$ (shown in color) and the corresponding streamlines the 95 m layer.
Citation: Belonenko Tatyana V., Vladimir S. Travkin, Aleksey V. Koldunov, Denis L. Volkov (2021), Topographic experiments over dynamical processes in the Norwegian Sea, Russ. J. Earth Sci., 21, ES1006, doi:10.2205/2020ES000747.
Copyright 2021 by the Geophysical Center RAS.
Generated from LaTeX source by ELXfinal, v.2.0 software package.

