RUSSIAN JOURNAL OF EARTH SCIENCES, VOL. 21, ES2003, doi:10.2205/2020ES000744, 2021
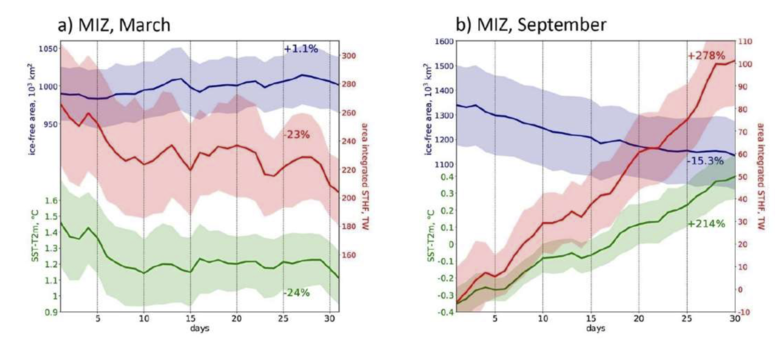
Figure 4. Mean (1979–2010 period) evolution of the ice-free area (blue) inside the MIZ (SIC 15–80%), STHF (red) and temperature gradient (SST-T2m, green) during (a) March and (b) September. Half sigma ranges are shaded.

![]()
Citation: Selivanova J., P. Verezemskaya, N. Tilinina, S. Gulev, S. Dobrolyubov (2021), The importance of the sea ice marginal zone for the surface turbulent heat fluxes in Arctic on the basis of NCEP CFSR reanalysis, Russ. J. Earth Sci., 21, ES2003, doi:10.2205/2020ES000744.
Copyright 2021 by the Geophysical Center RAS.
Generated from LaTeX source by ELXfinal, v.2.0 software package.