RUSSIAN JOURNAL OF EARTH SCIENCES, VOL. 21, ES2003, doi:10.2205/2020ES000744, 2021
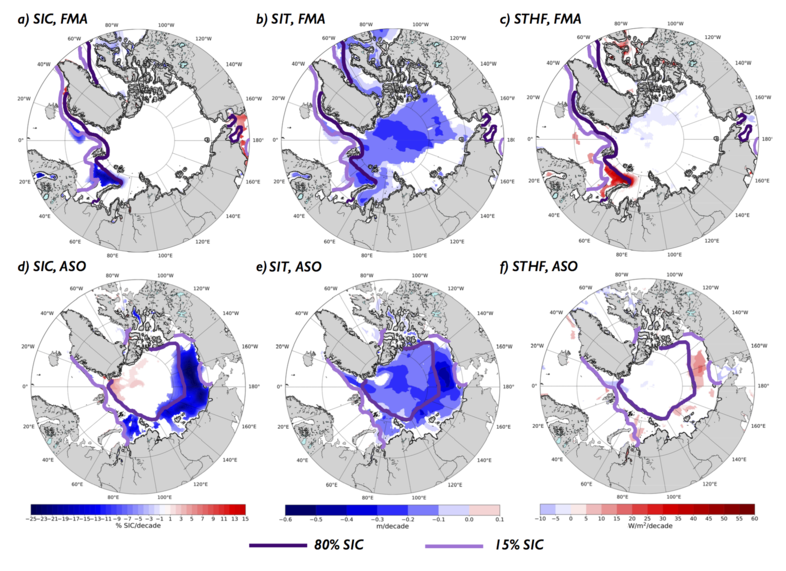
Figure 3. Linear trends of SIC (fraction per decade, a,d), SIT (m per decade, b, e) and STHF (W/m$^2$ per decade, c, f) for cold (FMA, upper panel) and warm (ASO, lower panel) seasons. Trends are significant at the 95% level according to the Student's t-test. Dark and light violet lines show correspondingly 80% and 15% SIC.

![]()
Citation: Selivanova J., P. Verezemskaya, N. Tilinina, S. Gulev, S. Dobrolyubov (2021), The importance of the sea ice marginal zone for the surface turbulent heat fluxes in Arctic on the basis of NCEP CFSR reanalysis, Russ. J. Earth Sci., 21, ES2003, doi:10.2205/2020ES000744.
Copyright 2021 by the Geophysical Center RAS.
Generated from LaTeX source by ELXfinal, v.2.0 software package.