RUSSIAN JOURNAL OF EARTH SCIENCES, VOL. 21, ES2003, doi:10.2205/2020ES000744, 2021
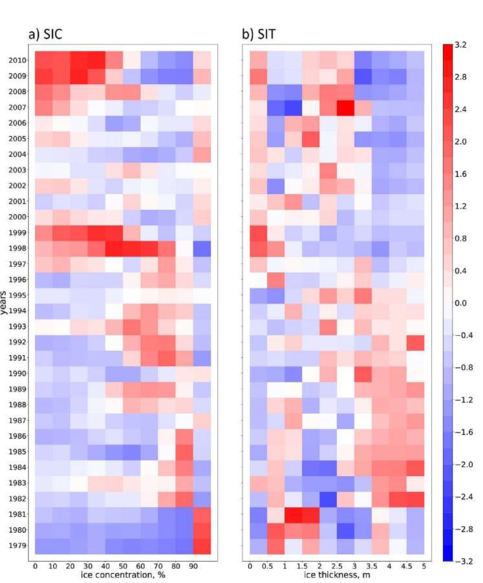
Figure 2. Anomalies of the occurrence of sea-ice of different concentration (a, SIC) and thickness (b, SIT), normalized by the standard deviation in September. Anomalies are calculated over the Arctic, where SIC and SIT are $> 0$ for the 1979–2010 period.

![]()
Citation: Selivanova J., P. Verezemskaya, N. Tilinina, S. Gulev, S. Dobrolyubov (2021), The importance of the sea ice marginal zone for the surface turbulent heat fluxes in Arctic on the basis of NCEP CFSR reanalysis, Russ. J. Earth Sci., 21, ES2003, doi:10.2205/2020ES000744.
Copyright 2021 by the Geophysical Center RAS.
Generated from LaTeX source by ELXfinal, v.2.0 software package.