RUSSIAN JOURNAL OF EARTH SCIENCES, VOL. 21, ES1004, doi:10.2205/2020ES000738, 2021
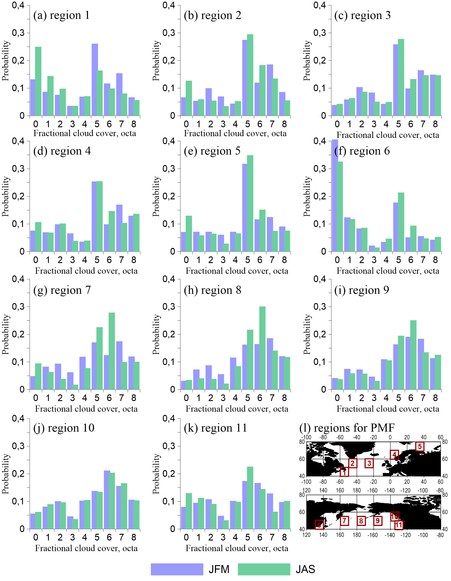
Figure 3. Empirical histograms of the fractional low cloud cover (octas) for selected regions (shown on the map (l)).

![]()
Citation: Aleksandrova M. (2021), Cloudiness over the oceans at subarctic latitudes as a visible part of atmospheric moisture transport, Russ. J. Earth Sci., 21, ES1004, doi:10.2205/2020ES000738.
Copyright 2020 by the Geophysical Center RAS.
Generated from LaTeX source by ELXfinal, v.2.0 software package.