RUSSIAN JOURNAL OF EARTH SCIENCES, VOL. 20, ES6009, doi:10.2205/2020ES000748, 2020
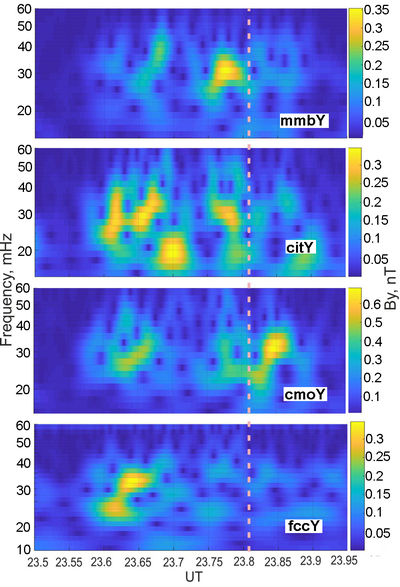
Figure 3. The result of time-frequency analysis of the signal for Y components of the magnetic field for MMB, SIT, CMO and FCC observatories. The red dashed line shows the moment of the explosion.

![]()
Citation: Gavrilov B. G., V. A. Pilipenko, Y. V. Poklad, I. A. Ryakhovsky (2020), Geomagnetic effect of the Bering Sea meteoroid, Russ. J. Earth Sci., 20, ES6009, doi:10.2205/2020ES000748.
Copyright 2020 by the Geophysical Center RAS.
Generated from LaTeX source by ELXfinal, v.2.0 software package.