RUSSIAN JOURNAL OF EARTH SCIENCES, VOL. 20, ES6005, doi:10.2205/2020ES000718, 2020

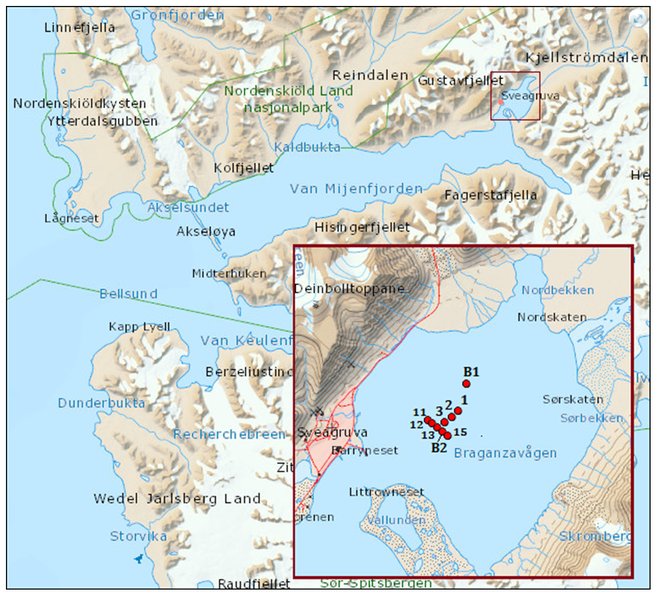
Figure 1. A map of the Van Mijenfjorden and Bragantzavägen Bay (https://toposvalbard.npolar.no/) with the positions of oceanographic and ice stations in spring 2016 and 2018 (in the inset). B1, B2 are mooring; 11, 12, 13, 15, B2 are locations bottom soil sampling; 1, 2, 3, B2 are locations of CTD profiling.
Citation: Bogorodskiy P. V., N. E. Demidov, K. V. Filchuk, A. V. Marchenko, E. G. Morozov, A. L. Nikulina, A. V. Pnyushkov, I. V. Ryzhov (2020), Growth of landfast ice and its thermal interaction with bottom sediments in the Braganzav\"{a}gen Gulf (West Spitsbergen), Russ. J. Earth Sci., 20, ES6005, doi:10.2205/2020ES000718.
Copyright 2020 by the Geophysical Center RAS.
Generated from LaTeX source by ELXfinal, v.2.0 software package.

