RUSSIAN JOURNAL OF EARTH SCIENCES, VOL. 20, ES1005, doi:10.2205/2020ES000693, 2020
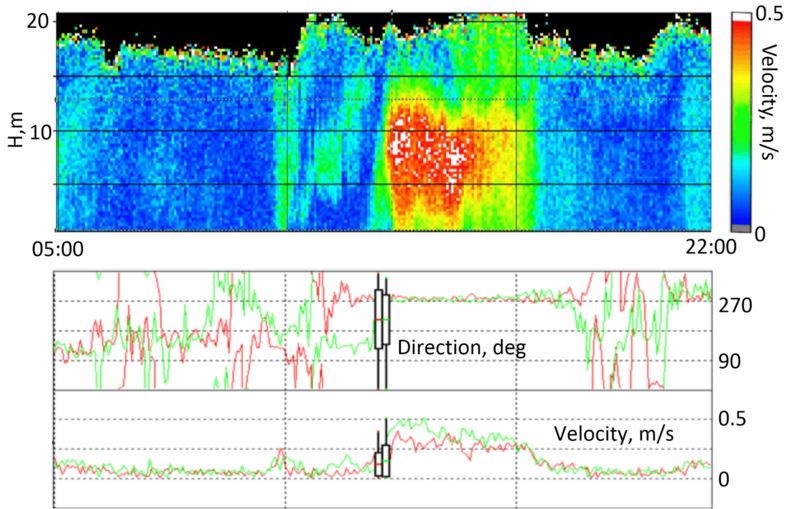
Figure 7. A fragment of the ADCP WHS 1200 record at a 130 m depth in 7 March from 5 a.m. to 10 p.m. Top panel: vertical profiles of current velocity magnitude during that period. A strong, about 2-hours long, increase in the velocity magnitude in the BBL can be seen. Its cause is unclear. Bottom panel: direction of current velocity and its magnitude. The red curve – 15 m depth, the green curve – 2.5 m depth. Black "whiskered boxes" show the corresponding standard deviations for the indicated time period.

![]()
Citation: Zatsepin A. G., V. V. Kremenetskiy, O. I. Podymov, A. G. Ostrovskii (2020), Study of the effects of Ekman dynamics in the bottom boundary layer on the Black Sea continental slope, Russ. J. Earth Sci., 20, ES1005, doi:10.2205/2020ES000693.
Copyright 2020 by the Geophysical Center RAS.
Generated from LaTeX source by ELXfinal, v.2.0 software package.