RUSSIAN JOURNAL OF EARTH SCIENCES, VOL. 20, ES1005, doi:10.2205/2020ES000693, 2020
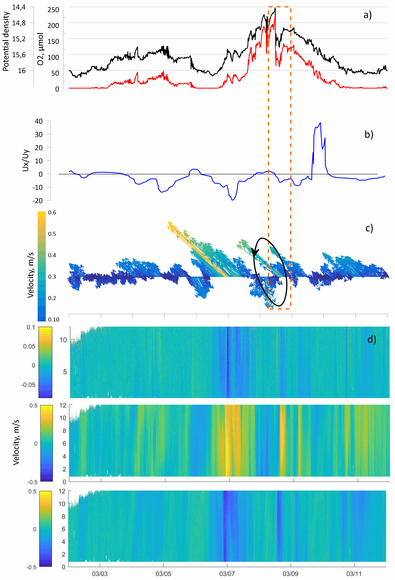
Figure 5. Changes in the BBL according to the measurements of SeaGuard RCM DW and ANDERAA 4330F optode (130 m installation depth) in the period of 2–12 March 2019: a) potential density (black curve), dissolved oxygen concentration (red curve); b) $U_x/U_y$ ratio; c) current velocity vectors in the BBL; the black oval with an arrow designates a cyclonic eddy; d) vertical profiles of vertical, alongshore and normal to the shore components of current velocity (top-down).

![]()
Citation: Zatsepin A. G., V. V. Kremenetskiy, O. I. Podymov, A. G. Ostrovskii (2020), Study of the effects of Ekman dynamics in the bottom boundary layer on the Black Sea continental slope, Russ. J. Earth Sci., 20, ES1005, doi:10.2205/2020ES000693.
Copyright 2020 by the Geophysical Center RAS.
Generated from LaTeX source by ELXfinal, v.2.0 software package.