RUSSIAN JOURNAL OF EARTH SCIENCES, VOL. 19, ES6003, doi:10.2205/2019ES000695, 2019
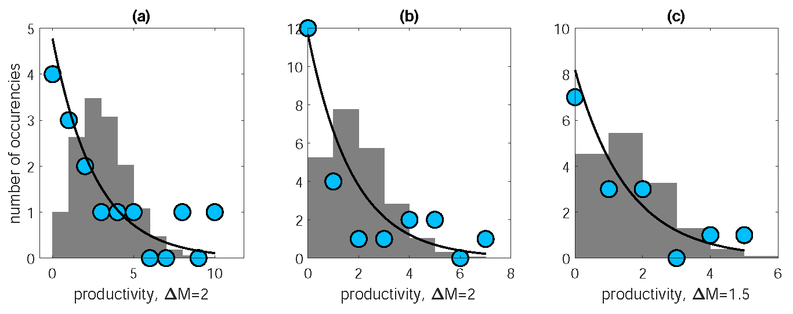
Figure 1. Earthquake productivity for three aftershock sequences. (a) – 27 February 2010, Mw=8.8, Chile earthquake, (b) – 11 March 2011, Mw=9.1, Tohoku earthquake, (c) – 11 April 2012, Mw=8.6, Sumatra earthquake. Dots show the number of triggered events for $M\geq6.5$ (Tohoku) and $M\geq6.0$ (Chile and Sumatra) triggering events using a relative magnitude threshold $\Delta M=1.5$. The solid line is the exponential law with parameter $\Lambda_0$, the clustering factor. The histogram shows the Poisson distribution with parameter $\Lambda_0$.

![]()
Citation: Baranov S. V., A. D. Gvishiani, C. Narteau, P. N. Shebalin (2019), Epidemic type aftershock sequence exponential productivity, Russ. J. Earth Sci., 19, ES6003, doi:10.2205/2019ES000695.
Copyright 2019 by the Geophysical Center RAS.
Generated from LaTeX source by ELXfinal, v.2.0 software package.