RUSSIAN JOURNAL OF EARTH SCIENCES, VOL. 19, ES6014, doi:10.2205/2019ES000689, 2019
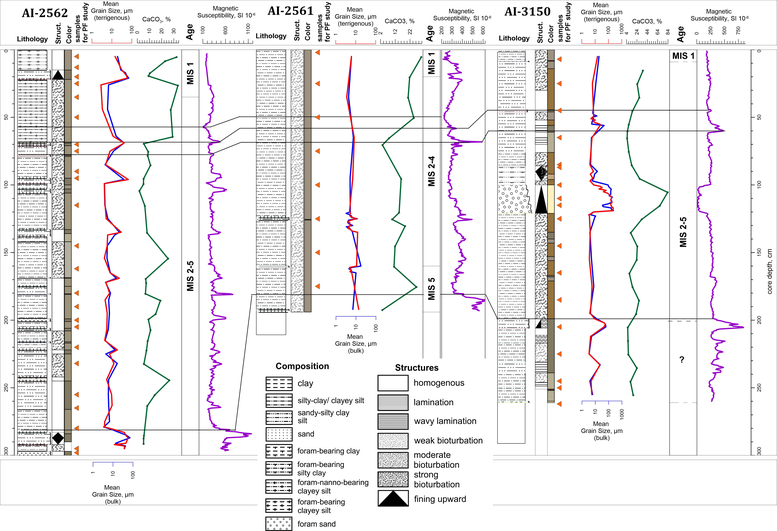
Figure 6. Lithology, calcium carbonate content, mean grain size (for bulk sediment and terrigenous fraction after removal of CaCO$_3$), magnetic susceptibility and age of sediments recovered from cores. Black solid lines mark correlation between sediment cores. Orange circles indicate sampling intervals for foraminiferal study. PF – planktic foraminifera. Location of cores is shown in Figure 1B.

![]()
Citation: Borisov Dmitrii G., Ivar O. Murdmaa, Elena V. Ivanova, Evgenia V. Dorokhova (2019), Late Quaternary lateral sedimentation in the São Tomé Seamount area of the western South Atlantic, Russ. J. Earth Sci., 19, ES6014, doi:10.2205/2019ES000689.
Copyright 2019 by the Geophysical Center RAS.
Generated from LaTeX source by ELXfinal, v.2.0 software package.