RUSSIAN JOURNAL OF EARTH SCIENCES, VOL. 19, ES6001, doi:10.2205/2019ES000687, 2019

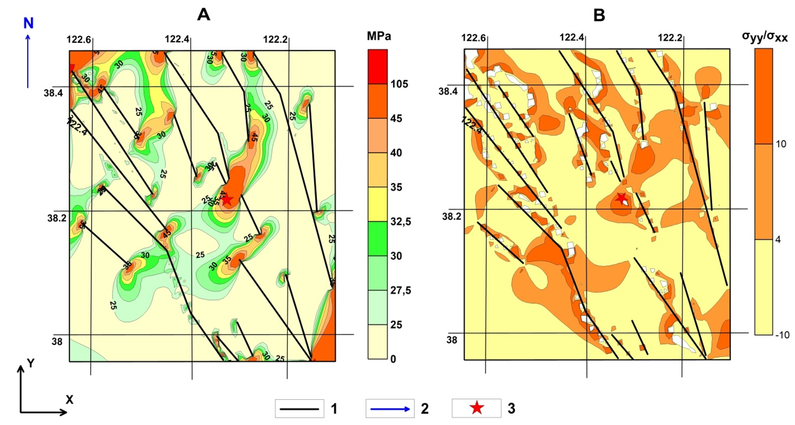
Figure 6. Results of SSS modeling of the epicentral zone before the Napa earthquake in South California on 24 August 2014, $M 6.0$ [Morozov et al., 2018b]. a) – stress intensity $\sigma_i$; b) – stress ratio $\sigma_{yy}/\sigma_{xx}$; 1 – tectonic faults; 2 – direction north; 3 – earthquake epicenter.
Citation: Morozov V. N., V. N. Tatarinov, A. I. Manevich, I. V. Losev (2019), Analogy method to determine the stress-strain state of structural-tectonic blocks of the Earth's crust for the disposal of radioactive waste, Russ. J. Earth Sci., 19, ES6001, doi:10.2205/2019ES000687.
Copyright 2019 by the Geophysical Center RAS.
Generated from LaTeX source by ELXfinal, v.2.0 software package.

