RUSSIAN JOURNAL OF EARTH SCIENCES, VOL. 19, ES5006, doi:10.2205/2019ES000677, 2019
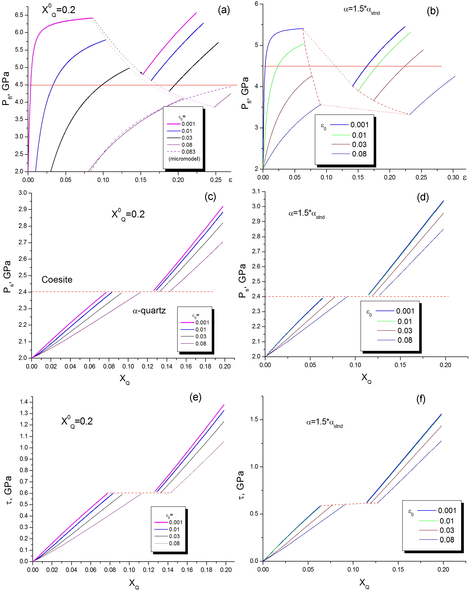
Figure 4. Results of calculations of different mechanical parameters at the decarbonatisation progress, each curve is calculated at the different initial porosities labeled on the plots a), b) $P_{\mathrm{fl}}$, fluid pressure as a function of the reaction porosity c), d) $P_s$, solid pressure (mean stress) within reacted inclusion e), f) $\tau$, deviatoric stress at the boundary of the inclusion in the host rocks. Iscontinuities on the plots are connected with $\alpha$-quartz–coesite transition. Left column displays results calculated with the first poroelastic model for Biot's coefficient $\alpha$ (the lowest values), right column is obtained for more well connected pore space with larger values of $\alpha$ as a function of porosity.

![]()
Citation: Simakin A. G. (2019), Poroelastic response to rapid decarbonatisation as a mechanism of the diamonds formation in the mantle wedge of Kamchatka, Russ. J. Earth Sci., 19, ES5006, doi:10.2205/2019ES000677.
Copyright 2019 by the Geophysical Center RAS.
Generated from LaTeX source by ELXfinal, v.2.0 software package.