RUSSIAN JOURNAL OF EARTH SCIENCES, VOL. 19, ES5002, doi:10.2205/2019ES000674, 2019
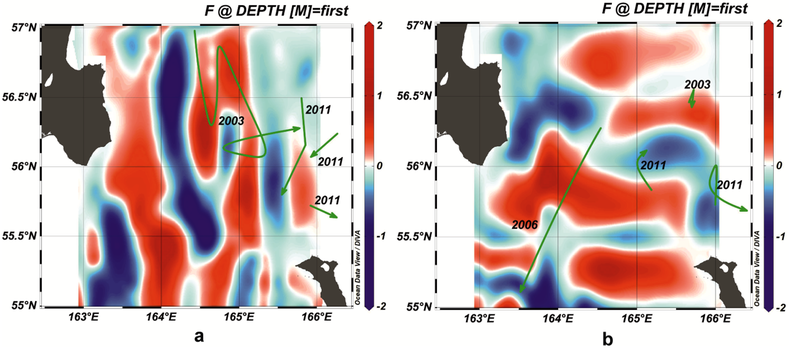
Figure 5. Buoy drift (green lines) at a depth of 200 m in May (a) and June (b), plotted on the water circulation map in the 200th layer.

![]()
Citation: Vlasova Galina, Svetlana Marchenko, Natalia Rudykh (2019), Modeling spring hydrodynamic regime of surface waters in Kamchatka Strait, Russ. J. Earth Sci., 19, ES5002, doi:10.2205/2019ES000674.
Copyright 2019 by the Geophysical Center RAS.
Generated from LaTeX source by ELXfinal, v.2.0 software package.