RUSSIAN JOURNAL OF EARTH SCIENCES, VOL. 19, ES4001, doi:10.2205/2019ES000671, 2019
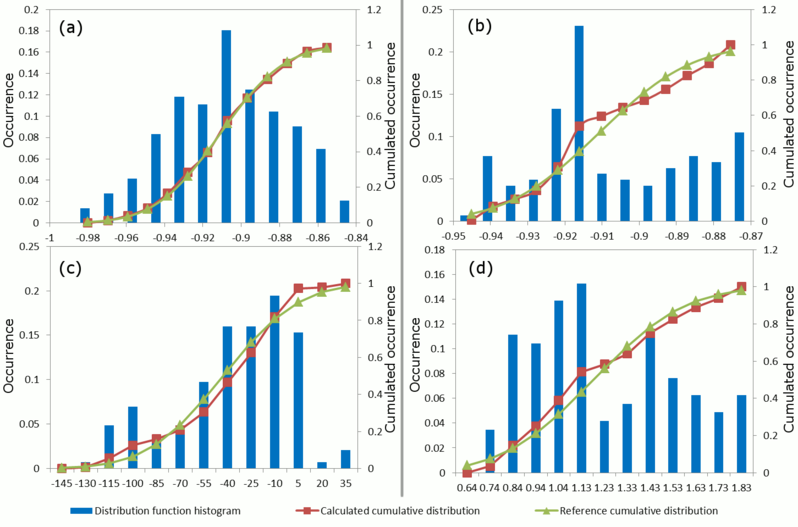
Figure 3. Statistical calculations to determine the distribution laws for the muon flux (a), muon flux trend component (b), $Dst$ index (c) and TEC (d) datasets. The distribution function histogram (blue bar plots) and the cumulative distribution (red curve with square markers) comparing to the generated reference cumulative distribution (green curve with triangle markers) generated, are presented for each dataset. The left vertical axis shows the distribution function values, and the right vertical axis shows the cumulative distribution function values for each plot.

![]()
Citation: Sidorov Roman, Anatoly Soloviev, Alexei Gvishiani, Viktor Getmanov, Mioara Mandea, Anatoly Petrukhin, Igor Yashin, Alexander Obraztsov (2019), A combined analysis of geomagnetic data and cosmic ray secondaries for the September 2017 space weather event studies, Russ. J. Earth Sci., 19, ES4001, doi:10.2205/2019ES000671.
Copyright 2019 by the Geophysical Center RAS.
Generated from LaTeX source by ELXshort, v.2.0 software package.