RUSSIAN JOURNAL OF EARTH SCIENCES, VOL. 19, ES4001, doi:10.2205/2019ES000671, 2019
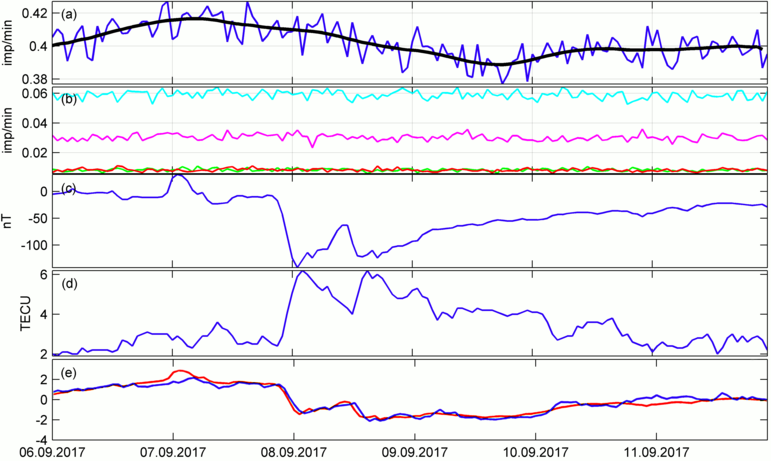
Figure 1. Inter-comparison between the muon intensity data from the center of the muon hodoscope matrices (a), from the four corners of the hodoscope matrices (b), the $Dst$ index (c), total electron content (d), and the generalized characteristic functions (e) $G1$ (red) and $G2$ (blue).

![]()
Citation: Sidorov Roman, Anatoly Soloviev, Alexei Gvishiani, Viktor Getmanov, Mioara Mandea, Anatoly Petrukhin, Igor Yashin, Alexander Obraztsov (2019), A combined analysis of geomagnetic data and cosmic ray secondaries for the September 2017 space weather event studies, Russ. J. Earth Sci., 19, ES4001, doi:10.2205/2019ES000671.
Copyright 2019 by the Geophysical Center RAS.
Generated from LaTeX source by ELXshort, v.2.0 software package.