RUSSIAN JOURNAL OF EARTH SCIENCES, VOL. 19, ES4004, doi:10.2205/2019ES000668, 2019
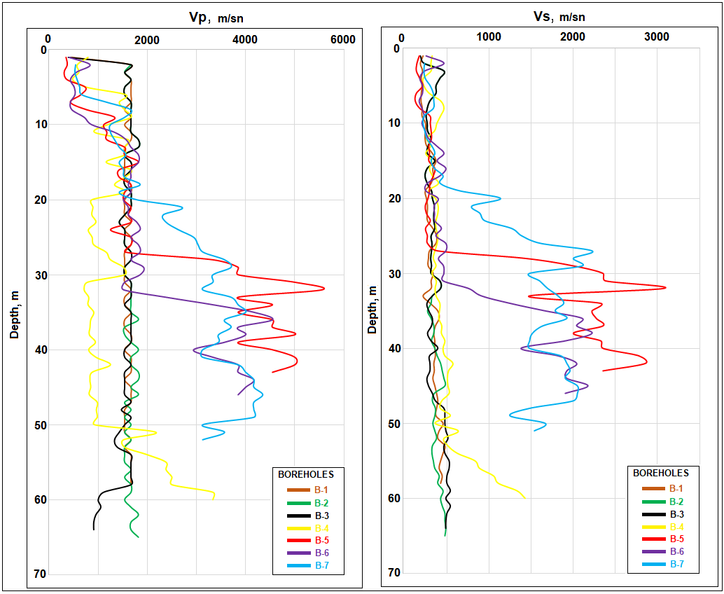
Figure 3. Comparative representation of velocities obtained from PS logging for all boreholes, a) $V_p$ values, b) $V_s$ values.

![]()
Citation: Keskinsezer Ayhan, Günay Beyhan, Javid Gallajov (2019), Investigation of the soil structure of the area between Yedikule to Sirkeci (Istanbul) using PS logging and earthquake data, Russ. J. Earth Sci., 19, ES4004, doi:10.2205/2019ES000668.
Copyright 2019 by the Geophysical Center RAS.
Generated from LaTeX source by ELXpaper, v.2.0 software package.