RUSSIAN JOURNAL OF EARTH SCIENCES, VOL. 19, ES4002, doi:10.2205/2019ES000663, 2019
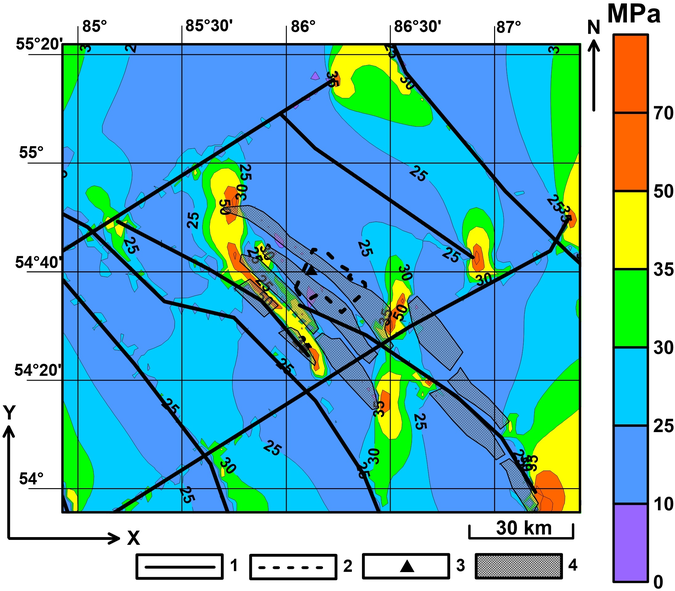
Figure 4. Map of stress intensity $\sigma_i$ after mining of fields: 1 – tectonic faults; 2 – agglomeration of Leninsk-Kuznetsky city; 3 – Leninsk-Kuznetsky city; 4 – mine fields of LCD scheduled to mining which refer to the area of the supposed dispersion of rocks.

![]()
Citation: Manevich A. I., K. S. Kolikov, E. A. Egorova (2019), Geoecological aspects of stress-strain state modeling results of Leninsky coal deposit (Kuzbass, Russia), Russ. J. Earth Sci., 19, ES4002, doi:10.2205/2019ES000663.
Copyright 2019 by the Geophysical Center RAS.
Generated from LaTeX source by ELXshort, v.2.0 software package.