RUSSIAN JOURNAL OF EARTH SCIENCES, VOL. 19, ES1005, doi:10.2205/2019ES000662, 2019
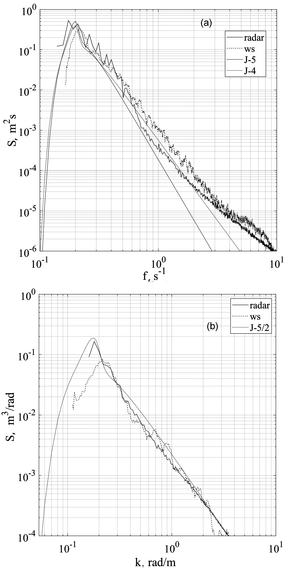
Figure 6. Temporal (a) and spatial (b) spectra of the wind-driven wave. The solid line represents the wave reconstructed from Doppler velocities data obtained with the coherent radar; the dotted line represents the wave gauge data; the dot-dash line represents JONSWAP $f^{-5}$ spectrum, prime mark is JONSWAP $f^{-4}$ spectrum (a) and JONSWAP $k^{-5/2}$ spectrum (b).

![]()
Citation: Ermoshkin A. V., I. A. Kapustin (2019), Estimation of the wind-driven wave spectrum using a high spatial resolution coherent radar, Russ. J. Earth Sci., 19, ES1005, doi:10.2205/2019ES000662.
Copyright 2019 by the Geophysical Center RAS.
Generated from LaTeX source by ELXpaper, v.2.0 software package.