RUSSIAN JOURNAL OF EARTH SCIENCES, VOL. 19, ES2008, doi:10.2205/2019ES000658, 2019
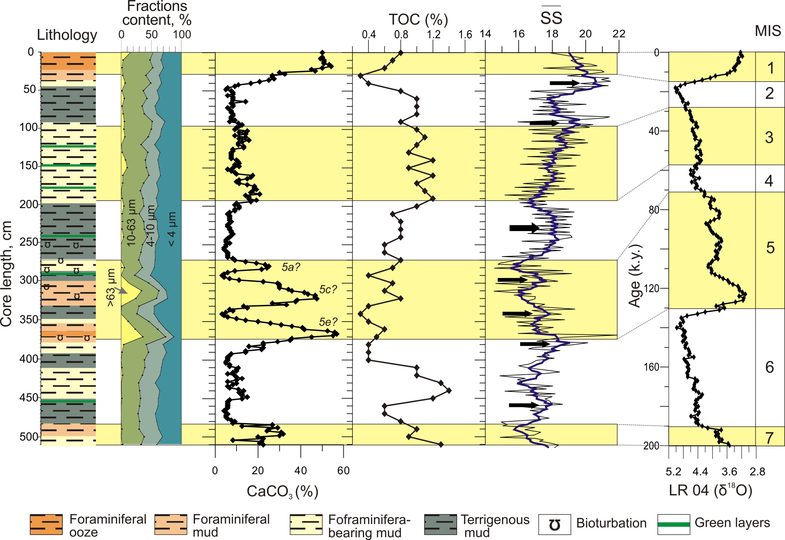
Figure 4. ANS-33056 core lithology, distribution of the fractions of the bulk sediment, CaCO$_3$ and TOC contents, as well as variability in the intensity of near-bottom paleocurrent ($\overline{SS}$) during the investigated period. Data of CaCO$_3$ are compared with the standard stable isotope curve LR04 [Lisiecki and Raymo, 2005]. Black arrows indicate an increase in intensity of the near-bottom current.

![]()
Citation: Sivkov V. V., L. D. Bashirova, E. V. Dorokhova, M. V. Kapustina, E. P. Ponomarenko (2019), Study of the Contourite Drift north of the Kane Gap (eastern equatorial Atlantic), Russ. J. Earth Sci., 19, ES2008, doi:10.2205/2019ES000658.
Copyright 2019 by the Geophysical Center RAS.
Generated from LaTeX source by ELXpaper, v.2.0 software package.