RUSSIAN JOURNAL OF EARTH SCIENCES, VOL. 19, ES2008, doi:10.2205/2019ES000658, 2019
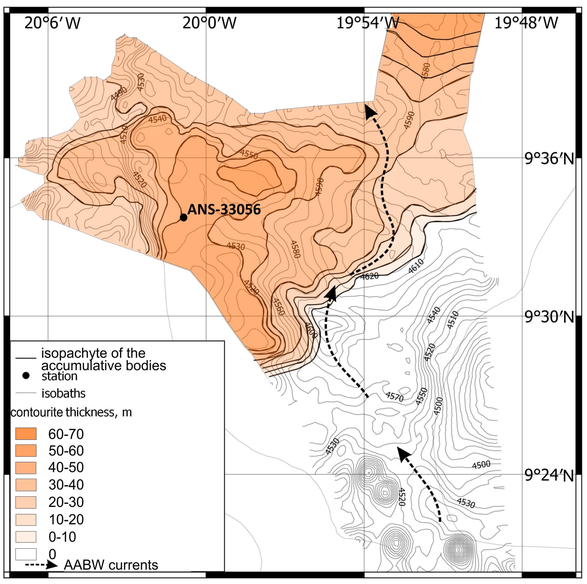
Figure 3. Digital model of the bottom topography created using a multibeam echo sounder data. Variation in the sediment thickness related to the acoustic basement north of the Kane Gap is also shown.

![]()
Citation: Sivkov V. V., L. D. Bashirova, E. V. Dorokhova, M. V. Kapustina, E. P. Ponomarenko (2019), Study of the Contourite Drift north of the Kane Gap (eastern equatorial Atlantic), Russ. J. Earth Sci., 19, ES2008, doi:10.2205/2019ES000658.
Copyright 2019 by the Geophysical Center RAS.
Generated from LaTeX source by ELXpaper, v.2.0 software package.