RUSSIAN JOURNAL OF EARTH SCIENCES, VOL. 19, ES2002, doi:10.2205/2019ES000656, 2019
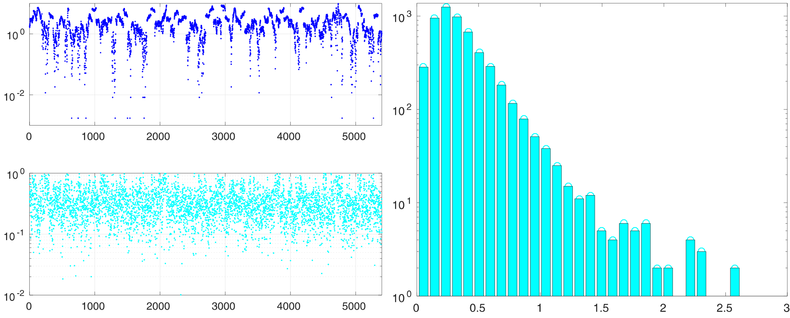
Figure 1. Data preprocessing: magnetic data collected from 13.02.2013 to 27.02.2013 for the time interval 12:00–13:00 UTC at Arti (ARS) observatory (location 56.433${}^\circ$N, 58.567${}^\circ$E). Left: horizontal axes show the sequential number of magnetic data, the intensity of $\lvert{\mathbf{B}}-\bar{{\mathbf{B}}}\rvert$ in nT, here $\bar{{\mathbf{B}}}$ is the mean field (top plot) and corresponding absolute values of variations $\lvert{\mathbf{b}}\rvert$ in nT (bottom plot). Right: histogram of $\lvert{\mathbf{b}}\rvert$ in the semilogscale.

![]()
Citation: Khokhlov A., R. Krasnoperov, B. Nikolov, J. Nikolova, M. Dobrovolsky, V. Petrov, D. Kudin, I. Belov (2019), On the directions and structure of the short-term magnetic variations, Russ. J. Earth Sci., 19, ES2002, doi:10.2205/2019ES000656.
Copyright 2019 by the Geophysical Center RAS.
Generated from LaTeX source by ELXpaper, v.2.0 software package.