RUSSIAN JOURNAL OF EARTH SCIENCES, VOL. 19, ES1005, doi:10.2205/2019ES000650, 2019
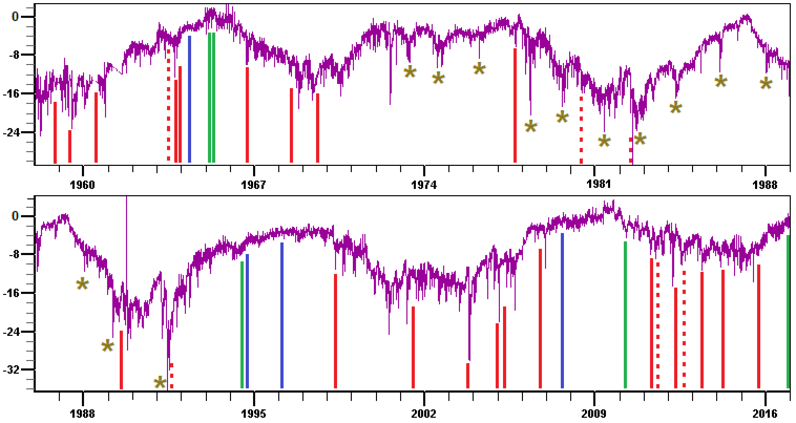
Figure 4. M$\geqslant8.2$ earthquakes and VEI$\geqslant$5 volcanic eruptions versus cosmic ray intensity (CRI) in 1958–2016. Daily average of CRI is shown in purple. M$\geqslant8.2$ earthquakes are marked by solid vertical lines, red lines indicate earthquakes near considerable drop-downs in CRI, green lines indicate earthquakes near insignificant drop-down, blue lines indicate earthquakes far away from any drop-downs. VEI$\geqslant 5$ volcanic eruptions are marked by dotted vertical lines, all of them are near drop-downs in CRI. The recurring drop-downs in 1973/5/17–1991/6/15 are marked by asterisks. (After http://cr0.izmiran.ru/mosc/ )

![]()
Citation: Kovalyov Mikhail (2019), On the correlation of seismic activity to syzygies., Russ. J. Earth Sci., 19, ES1005, doi:10.2205/2019ES000650.
Copyright 2019 by the Geophysical Center RAS.
Generated from LaTeX source by ELXpaper, v.2.0 software package.