RUSSIAN JOURNAL OF EARTH SCIENCES, VOL. 19, ES3004, doi:10.2205/2018ES000653, 2019
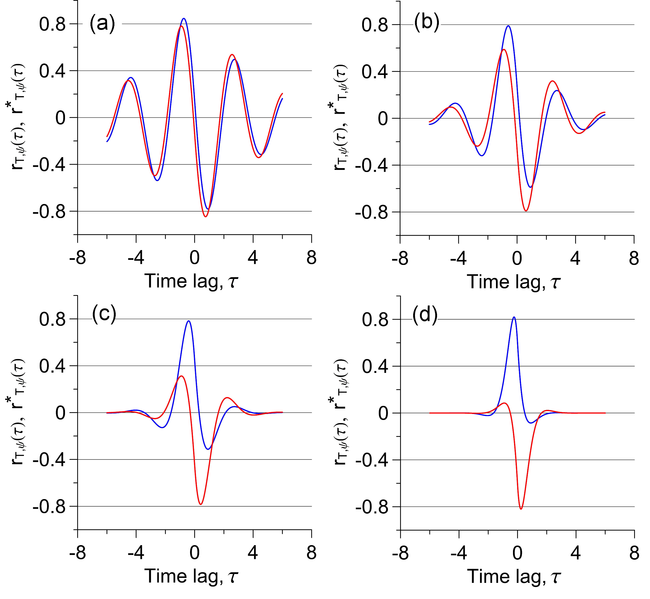
Figure 1. Normalized cross-correlation functions of $T(t)$ and $\psi_m(t)$. $ r_{T, \psi_m} (\tau)$ (blue line), $ r^*_{T, \psi_m} (\tau)$ (red line). The positive time lags correspond to the leading SST (AMO index). $ms=3$, a) $\alpha=\lambda = 0.25$, b) $\alpha=\lambda = 0.5$, c) $\alpha=\lambda = 1.0$, d) $\alpha=\lambda = 2.0$. The parameter values $\alpha=\lambda = 0.5$ corresponds to e-folding time equal to 2 units of dimensionless time and, respectively, to 8 years.

![]()
Citation: Bekryaev Roman V. (2019), Interrelationships of the North Atlantic multidecadal climate variability characteristics, Russ. J. Earth Sci., 19, ES3004, doi:10.2205/2018ES000653.
Copyright 2019 by the Geophysical Center RAS.
Generated from LaTeX source by ELXpaper, v.2.0 software package.