RUSSIAN JOURNAL OF EARTH SCIENCES, VOL. 19, ES2001, doi:10.2205/2018ES000649, 2019
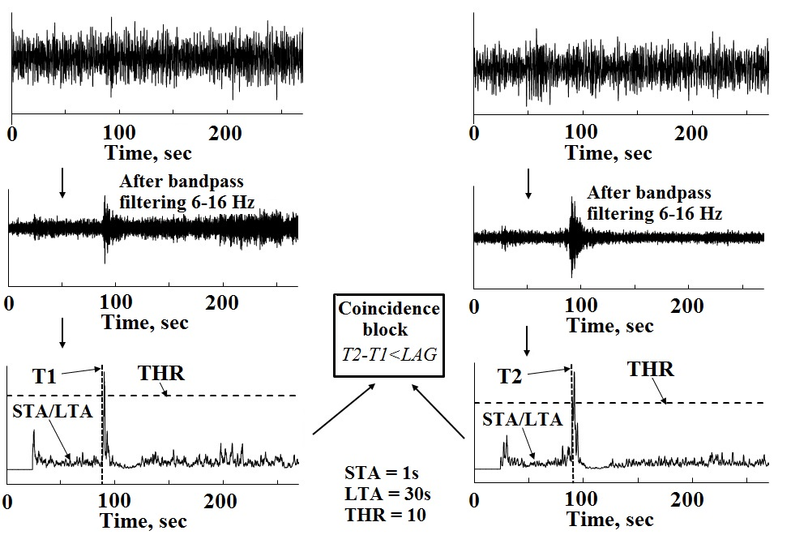
Figure 5. Example of the proposed algorithm performance for the same event recorded at two different seismic stations: left – station 1; right – station 2. Three plots for each station show: upper – raw record; middle – record after bandpass filtering (6–16 Hz); lower – detected events at both stations are compared with each other for consistency.

![]()
Citation: Krylov A. A., L. I. Lobkovsky, A. I. Ivashchenko (2019), Automated detection of microearthquakes in continuous noisy records produced by local ocean bottom seismographs or coastal networks, Russ. J. Earth Sci., 19, ES2001, doi:10.2205/2018ES000649.
Copyright 2019 by the Geophysical Center RAS.
Generated from LaTeX source by ELXpaper, v.2.0 software package.