RUSSIAN JOURNAL OF EARTH SCIENCES, VOL. 19, ES1002, doi:10.2205/2018ES000641, 2019

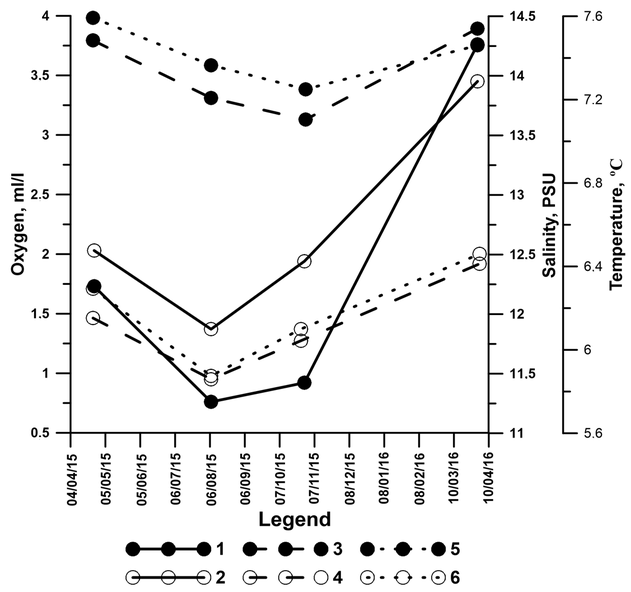
Figure 2. Changes in the concentration of dissolved oxygen, salinity and temperature in the bottom layer of the Gdansk and Gotland Basins from 24.04.2015 to 04.04.2016. 1 – concentration of oxygen at station 1; 2 – oxygen concentration at station 5; 3 – salinity at station 1; 4 – salinity at station 5; 5 – temperature at station 1; 6 – temperature at station 5.
Citation: Krechik V. A., M. V. Kapustina, V. N. Lukashin, E. E. Ezhova (2019), Variability of hydrological and hydrochemical conditions of Gotland and Gdansk Basins' bottom waters (Baltic Sea) in 2015–2016, Russ. J. Earth Sci., 19, ES1002, doi:10.2205/2018ES000641.
Copyright 2019 by the Geophysical Center RAS.
Generated from LaTeX source by ELXpaper, v.2.0 software package.

