RUSSIAN JOURNAL OF EARTH SCIENCES, VOL. 18, ES6006, doi:10.2205/2018ES000646, 2018
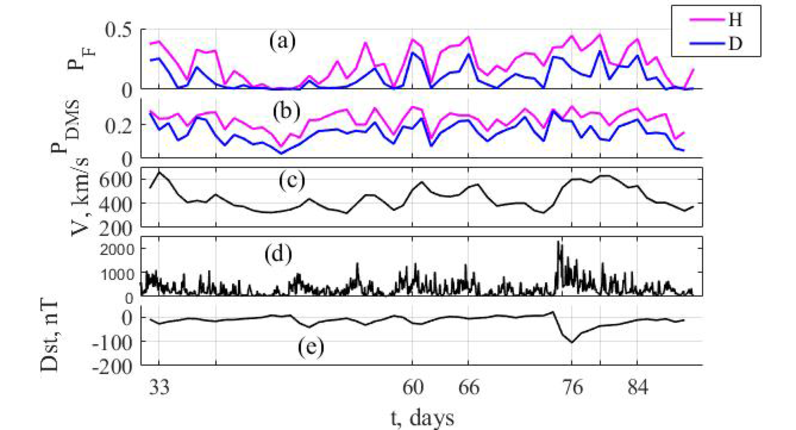
Figure 3. Day-to-day variations of the Pc3 occurrence rate P during DOY=30–90 at station BSL determined as $N_{Pc3}/N_{t}$, where $N_{Pc3}$ is the number of intervals with detected Pc3 signals, $N_t$ is the total number of intervals during one day. The result by the F-method (a) and DSP method (b). Dailly averaged values of solar wind velocity V (c), hourly maximal AE index (d), and daily mean Dst index (e).

![]()
Citation: Bogoutdinov Sh. R., N. V. Yagova, V. A. Pilipenko, S. M. Agayan (2018), A technique for detection of ULF Pc3 waves and their statistical analysis, Russ. J. Earth Sci., 18, ES6006, doi:10.2205/2018ES000646.
Copyright 2018 by the Geophysical Center RAS.
Generated from LaTeX source by ELXpaper, v.1.5 software package.