RUSSIAN JOURNAL OF EARTH SCIENCES, VOL. 18, ES6006, doi:10.2205/2018ES000646, 2018
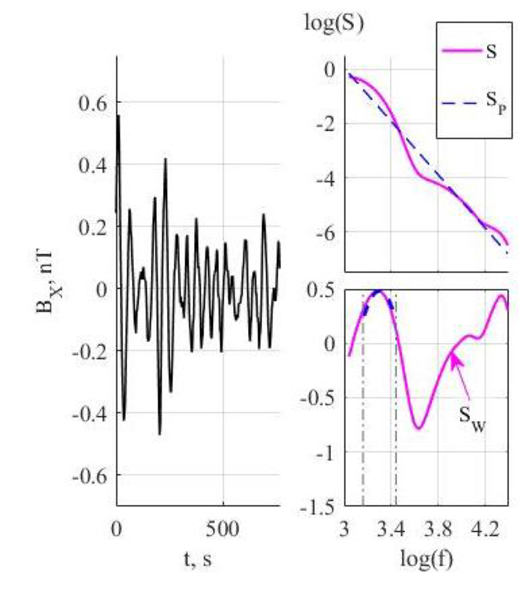
Figure 1. Illustration of the signal selection algorithm based on the analysis of their spectral power. High pass ($f_L$=10 mHz) filtered magnetogram is shown at left-hand panel, log-log PSD spectrum $S(\bar{f})$ and its linear approximation $S_P (\bar{f})$ are given at right-hand upper panel (upper panel). The linear detrended (whitened) log-log spectrum $S_W (\bar{f})$ is shown at the right lower panel (magenta) and its parabolic approximation in the vicinity of maximum is shown with a blue dashed line.

![]()
Citation: Bogoutdinov Sh. R., N. V. Yagova, V. A. Pilipenko, S. M. Agayan (2018), A technique for detection of ULF Pc3 waves and their statistical analysis, Russ. J. Earth Sci., 18, ES6006, doi:10.2205/2018ES000646.
Copyright 2018 by the Geophysical Center RAS.
Generated from LaTeX source by ELXpaper, v.1.5 software package.