RUSSIAN JOURNAL OF EARTH SCIENCES, VOL. 18, ES5006, doi:10.2205/2018ES000630, 2018
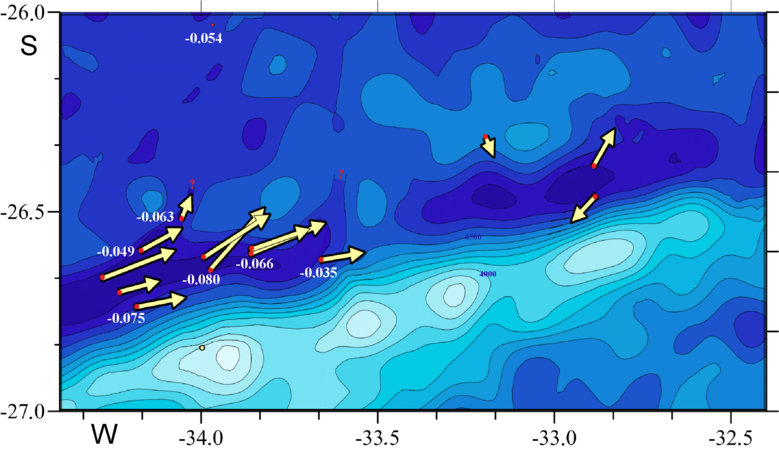
Figure 2. Bathymetry of the study area based on Smith [ampersand] Sandwell database and corrected with our echo-sounder measurements in 2010–2014. Locations of CTD/LADCP casts (red dots) are shown. The yellow arrows show the directions of currents and their velocity (vectors). White numbers at the dots of stations indicate potential temperature at the bottom. The yellow dot shows the location of sediment sampling site.

![]()
Citation: Morozov E. G., R. Yu. Tarakanov, D. I. Frey, D. G. Borisov (2018), Currents and water structure north of the Vema Channel, Russ. J. Earth Sci., 18, ES5006, doi:10.2205/2018ES000630.
Copyright 2018 by the Geophysical Center RAS.
Generated from LaTeX source by ELXpaper, v.1.5 software package.