RUSSIAN JOURNAL OF EARTH SCIENCES, VOL. 18, ES5001, doi:10.2205/2018ES000628, 2018
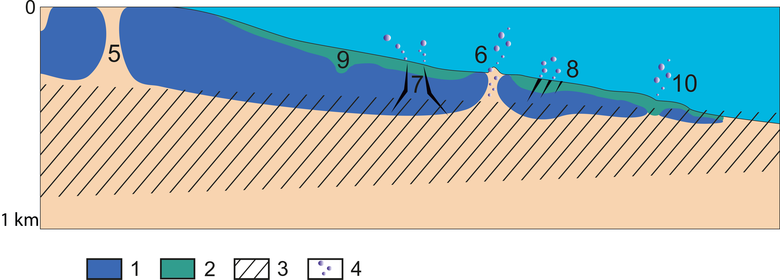
Figure 2. Schematic section of the onshore (left) and subsea (right) permafrost. Explanation: 1 – ice-bonded permafrost, 2 – near-bottom thawed layer, 3 – gas hydrate stability zone, 4 – methane release site, 5 – through talik, 6 – pingo, 7 – cracks, 8 – plough marks, 9 – paleobed, 10 – crater.

![]()
Citation: Piskunova E. A., N. A. Palshin, D. V. Yakovlev (2018), Electrical conductivity features of the Arctic shelf permafrost and electromagnetic technologies for their studies, Russ. J. Earth Sci., 18, ES5001, doi:10.2205/2018ES000628.
Copyright 2018 by the Geophysical Center RAS.
Generated from LaTeX source by ELXpaper, v.1.5 software package.