RUSSIAN JOURNAL OF EARTH SCIENCES, VOL. 18, ES5001, doi:10.2205/2018ES000628, 2018
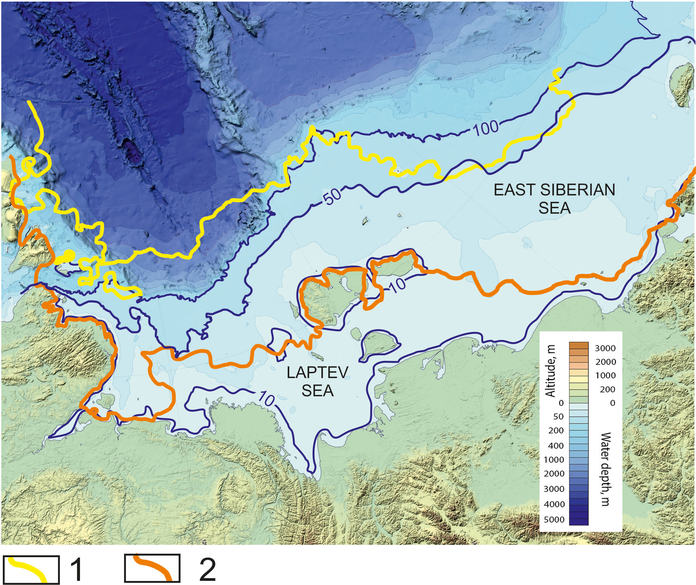
Figure 1. Bathymetric chart of the Laptev and East-Siberian seas. Bold isobath lines correspond to 10, 50 and 100 m depth. Explanation: 1 – ice cover boundary in September 2017, 2 – ice cover boundary in September 1998.

![]()
Citation: Piskunova E. A., N. A. Palshin, D. V. Yakovlev (2018), Electrical conductivity features of the Arctic shelf permafrost and electromagnetic technologies for their studies, Russ. J. Earth Sci., 18, ES5001, doi:10.2205/2018ES000628.
Copyright 2018 by the Geophysical Center RAS.
Generated from LaTeX source by ELXpaper, v.1.5 software package.