RUSSIAN JOURNAL OF EARTH SCIENCES, VOL. 18, ES3002, doi:10.2205/2018ES000621, 2018
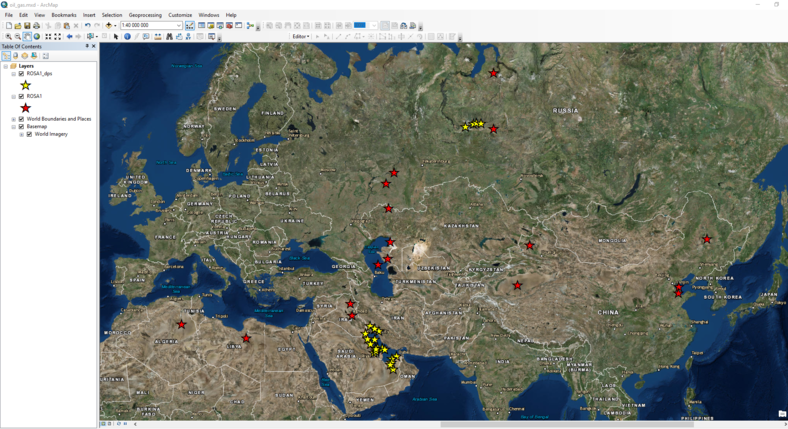
Figure 8. Visualization of the DPS algorithm application result in ArcMap. Clusters are shown in yellow.

![]()
Citation: Odintsova A., A. Gvishiani, N. Nakicenovic, A. Rybkina, S. Busch, J. Nikolova (2018), The world's largest oil and gas hydrocarbon deposits: ROSA database and GIS project development, Russ. J. Earth Sci., 18, ES3002, doi:10.2205/2018ES000621.
Copyright 2018 by the Geophysical Center RAS.
Generated from LaTeX source by ELXpaper, v.1.5 software package.