RUSSIAN JOURNAL OF EARTH SCIENCES, VOL. 18, ES1004, doi:10.2205/2018ES000616, 2018
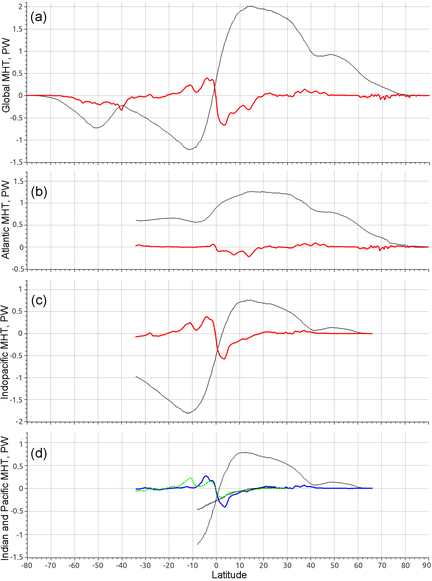
Figure 7. Distributions of the zonally integrated total (thin black lines) and eddy-induced (thick color lines) MHT in: (a) the world ocean, (b) the Atlantic Ocean, (c) the Indo-Pacific basin, and (d) the Indian and Pacific oceans separately (dashed and solid lines, respectively).

![]()
Citation: Ushakov K. V., R. A. Ibrayev (2018), Assessment of mean world ocean meridional heat transport characteristics by a high-resolution model, Russ. J. Earth Sci., 18, ES1004, doi:10.2205/2018ES000616.
Copyright 2018 by the Geophysical Center RAS.
Generated from LaTeX source by ELXpaper, v.1.5 software package.