RUSSIAN JOURNAL OF EARTH SCIENCES, VOL. 18, ES1001, doi:10.2205/2018ES000609, 2018

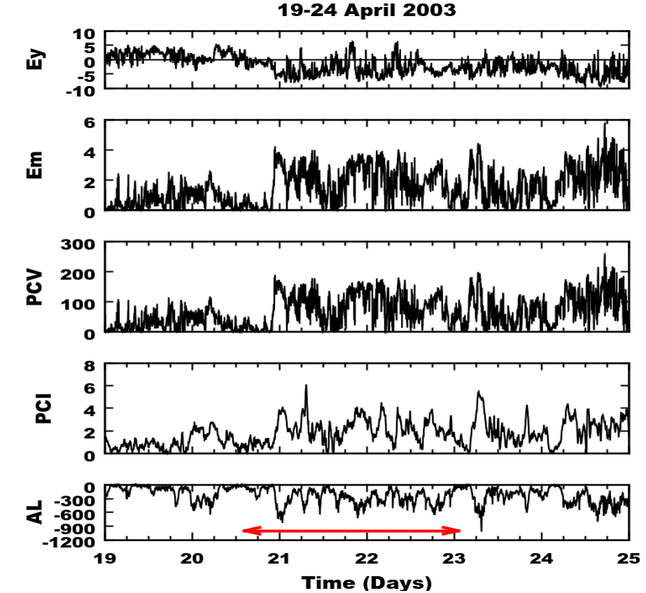
Figure 2. From top to bottom, (a) Interplanetary Electric Field ($Ey$ in mV/m), (b) PCV (in kV), (c) PCI (mV/m) and (d) AL index (nT) for a non-storm HILDCAA event during 20–23 April, 2003. The purple horizontal double-headed arrow at the bottom of the plot indicates the HILDCAA interval.
Citation: Adhikari B., N. Sapkota, B. Bhattarai, R. K. Mishra, S. Bohara, N. P. Chapagain, B. Regmi (2018), Study of interplanetary parameters, polar cap potential, and polar cap index during quiet event and high intensity long duration continuous AE activities (HILDCAAs), Russ. J. Earth Sci., 18, ES1001, doi:10.2205/2018ES000609.
Copyright 2018 by the Geophysical Center RAS.
Generated from LaTeX source by ELXpaper, v.1.5 software package.

