RUSSIAN JOURNAL OF EARTH SCIENCES, VOL. 18, ES2002, doi:10.2205/2017ES000610, 2018
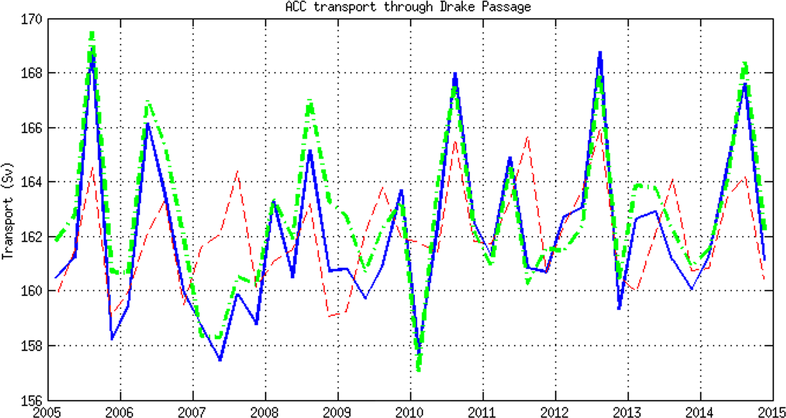
Figure 3. ACC transport (Sv) through the Drake Passage calculated using AMIGO data (blue solid line), using Experiment 1 (green dash-dotted line), and Experiment 2 data (red dashed line). All the data are represented as seasonal values over the period of 2005–2014.

![]()
Citation: Lebedev K. V., R. Yu. Tarakanov (2018), A model study of the wind stress influence on the interannual variability of the Antarctic Circumpolar Current, Russ. J. Earth Sci., 18, ES2002, doi:10.2205/2017ES000610.
Copyright 2018 by the Geophysical Center RAS.
Generated from LaTeX source by ELXpaper, v.1.5 software package.